Why we decided to rebuild our Sidekiq infrastructure to support greater scale

We often exhausted our processing capacity which led to hours-long incidents and long delays for our users. Our on-call personnel had to deal with these incidents manually, but had insufficient tooling. And adding new threads didn’t help. In fact, we often only realized something was wrong several hours later due to missing monitoring. We also often overwhelmed the database leading to poor frontend response times.
These problems were not a consequence of Sidekiq being unperformant or Ruby on Rails not being compiled, but a design flaw of the queues that didn’t consider the most important characteristics of the system.
A year ago we switched to a fundamentally different concept and in this post I’ll guide you through the approach in detail from the implications on our infrastructure setup, to how we prioritize and measure jobs.
Application context
Sidekiq is a great framework for asynchronous processing for Ruby on Rails applications. It uses Redis to store jobs. We pay for the Enterprise version as it provides additional features. It allows us to spread load, even with bursts over time, so that our infrastructure could be used efficiently. Our major bottleneck is the PostgreSQL databases we use to compute & store our analytics data.
Background processing is handy as you don’t have to be always scaled up to handle the peak load on demand, when most of the time you need much less capacity. But at the same time, you also have to be careful not to break important non-functional requirements. One of them is that accounts should not be starved while another account is running a large processing batch.
How does our application scale?
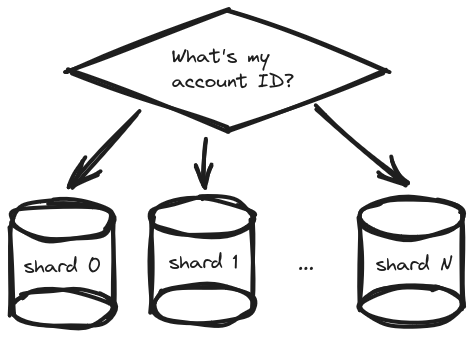
Before we dive into Sidekiq, it’s important to explain the relevant context of our application. To scale we’ve been using database sharding since the application’s inception:
A database shard, or simply a shard, is a horizontal partition of data in a database or search engine. Each shard is held on a separate database server instance, to spread load.
— Shard (database architecture), Wikipedia
In our case we split data to separate shards by account. And as our user base grows, we just add a new database shard from time to time.
The load should spread evenly as long as the accounts behave randomly without huge excesses. This is not always the case, though, and sometimes the main limitation of this approach becomes apparent — one shard has a fixed capacity and you can’t give an account the processing capacity of more than one shard. There are remedies like vertical scaling of database (ie. upgrade the instance type on AWS), but they’re expensive and optimally we’d like the system to self-regulate.
Sidekiq cluster
Before we start talking about the queues let me explain how we had the infrastructure set up. That way you will have a better idea about the components we’re going to talk about. First let’s have a look at how you can set up a Sidekiq cluster in theory:
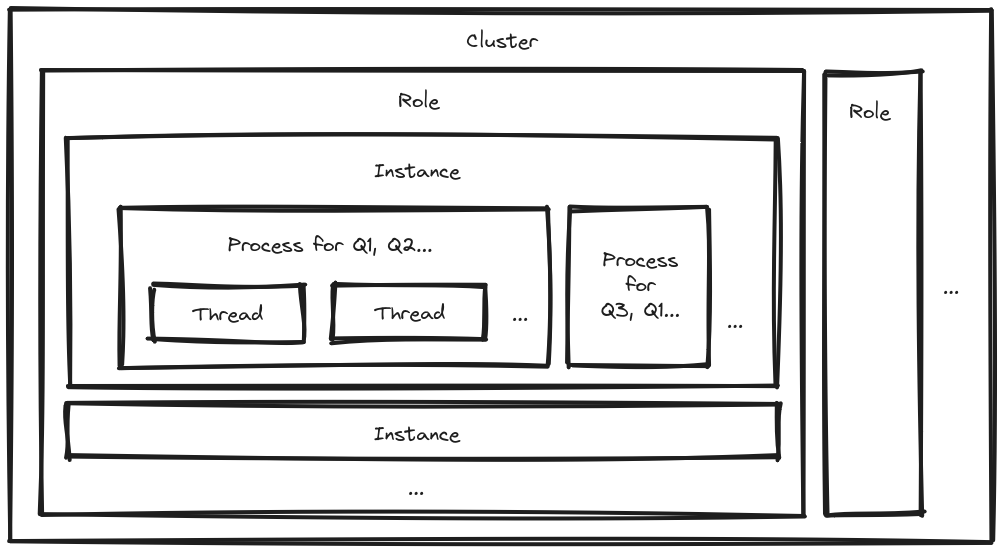
The smallest grain of processing capacity in this overview is the thread. It gives you processing capability for one job at a time. A job has a job class and arguments. These are the very basics of Sidekiq. You can think about the thread as the consumer part in the distributed producer-consumer pattern.
How do you determine which jobs to assign to threads? You configure this for each process. It has a list of queues to consume from (eg. Q1, Q2…). Now, you can use weighted queues, but we opted for strict priority as it gives better performance and it’s easier to reason about.
You can have multiple processes per instance, which will typically live somewhere in the cloud, for example as an AWS EC2 instance. Perhaps you want to set up a certain arrangement of configurations for such an instance – let’s call it a role. You can then deploy multiple copies of such instances with the same role to scale. All of this together we call a Sidekiq cluster.
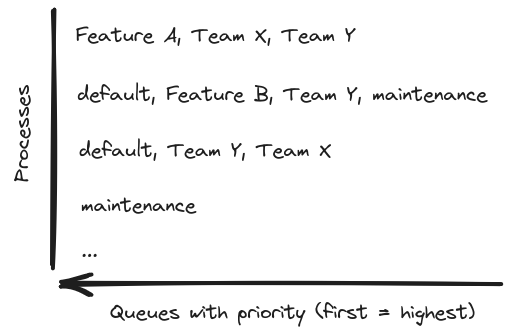
Original setup
We had multiple queues that were named by what the jobs there were approximately doing. But also a lot of them were named after their teams or subsystems managed by those teams. This unsurprisingly follows Conway’s law:
Any organization that designs a system (defined broadly) will produce a design whose structure is a copy of the organization’s communication structure.
We had some queues that implied low or high priority, but also a very highly prioritized default queue — so if you just forgot to name a specific queue, your job class got really lucky. It now had the highest priority in the app, congratulations! We also had a mixture of roles in the cluster, which shuffled these queues in different setups, which looked somewhat random. That often led to unexpected side effects, like a dedicated capacity for low priority queues that ran jobs even during high load.
How did we arrive to such a situation? Over the years different developers added new jobs to implement features and always tweaked the queues just a little bit to make their one feature work. However after many such iterations, while the system didn’t have any guiding design principle, it became a very complicated tangle of queues, where nobody understood all the consequences.
Another problem was scalability. Each instance that we had was running several processes with a mixture of queues, several virtual central processing units (vCPUs) and 20 GB of RAM. To consume some queue faster, you had to add expensive instances and we had little idea how efficiently we were using them. The catch is that Ruby processes running on CRuby can leverage just one vCPU disregarding number of internal threads due to Global Interpreter Lock.
Imagine you have 6 vCPUs on an instance, but only 2 processes are consuming queues with jobs:
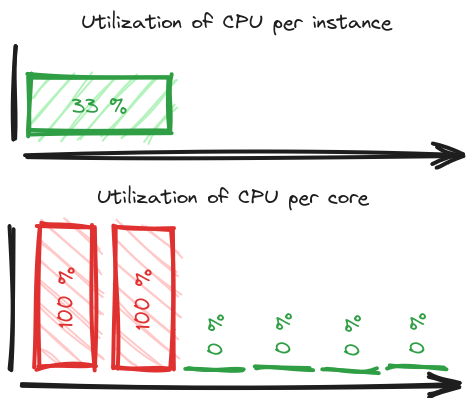
You’ll see around 33 % utilization, because the other 4 cores have nothing to do. If you don’t know the above-mentioned technical details, you might be left wondering how come the queues are not being consumed while the instance is underutilized. But in reality the ones that can do something, are overwhelmed.
Typical incident scenario
To illustrate better our increasing motivation for the new design, let’s imagine a typical incident. You come to work and you see a queue is growing for a couple of hours linearly. No signs of the situation improving. You also see warnings that one shard is very busy, but other shards are not:
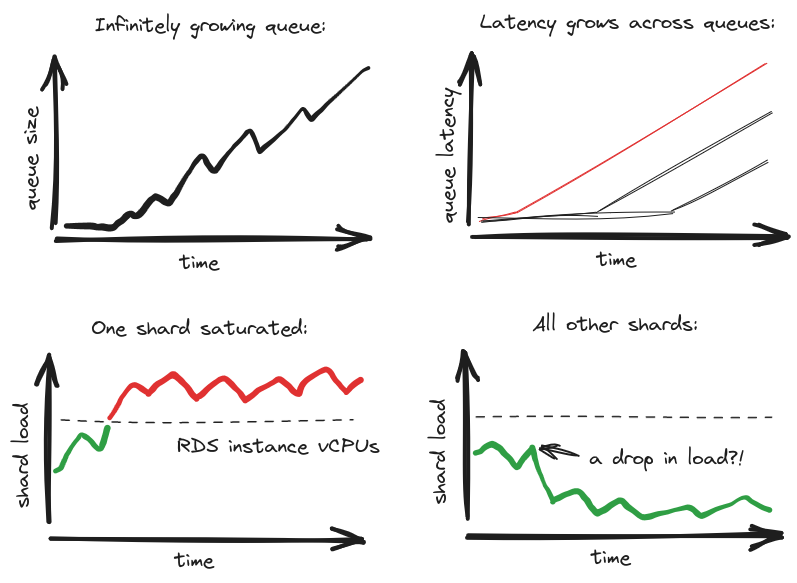
Additionally, when you look at pgbouncer connection pool statistics, you see a flat line near the maximum for the overwhelmed shard. You can see client connections waiting to get anything done on the database and when they get there, the queries run excessively long. This means the jobs also run excessively long. Meanwhile all Sidekiq threads that can process the growing queue are busy, while others are sitting idle. All of this points to the fact that our design is not distributing load evenly across shards, so that jobs that could easily get processed on underutilized shards wait behind jobs that struggle on the saturated DB shard.
Introducing: Kubernetes
Previously we migrated to AWS, and with that we also introduced Kubernetes into our infrastructure stack. With this step we gained new possibilities of infrastructure as code (IaC) and autoscaling. However, to leverage the cloud resources fully and perhaps to save some budget we had to first research a bit and adjust the system.
The original setup was not ready for autoscaling – the instances were too big and it was not clear what metric to pick for scaling. Even the jobs themselves were not ready as they expected the instances to run continually for 24 hours between deployments. So, we knew we had to get smaller instances and optimize some of the jobs, but what queues should we use?
Learning
Before designing the changes, I already realized that throwing jobs into random queues doesn’t scale. I also noticed we’re lacking a meaningful way to distribute the load generated by our asynchronous processing on the database shards. This became obvious through addressing repeated incidents when a particular database shard got saturated either on CPU or allocated I/O operations per second (IOPS). Meanwhile other shards were not loaded, even though we had jobs for those shards sitting for very long time in the queues.

A colleague recommended to me the book & workshop Sidekiq in Practice by Nate Berkopec. It was a very insightful reading that inspired me to rethink the system from ground up.
Thinking about users
Until now we talked about different system parameters, but we stayed completely silent about the final consumers of the analytics — the users. The ultimate goal of all of our processing is to be ready to show something to the user — be it a notification, a chart or some numbers in a table. Our users need those to gain insights about their business. And different parts need to be delivered within different timelines. For this we leverage the SLA-SLO-SLI framework:
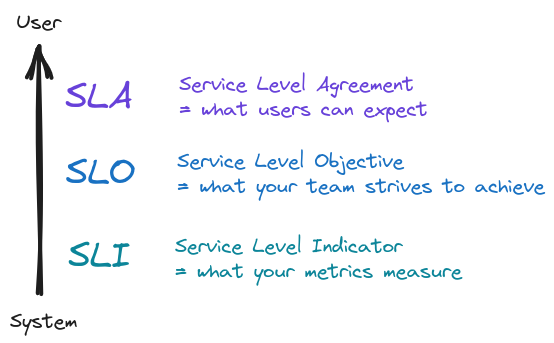
It is important to realize two facts:
- Your SLOs must be measurable and that means you must be able to come up with matching SLIs. Otherwise you won’t be able to evaluate impact of changes and you won’t know if they are for the better or worse.
- Fulfilling individual SLOs might not correspond to fulfilling the overall SLA. Think about a user waiting for an action to finish — but the action is composed of multiple jobs. Individual jobs might run fast, but maybe they interact in such a way that the overall action takes long time to finish. That’s why it’s also a good idea to have end-to-end measurements.
Finally, the new design
If you managed to read this far, I have good news! We now have enough background to introduce the new design that solves our issues and adds some perks as a bonus.
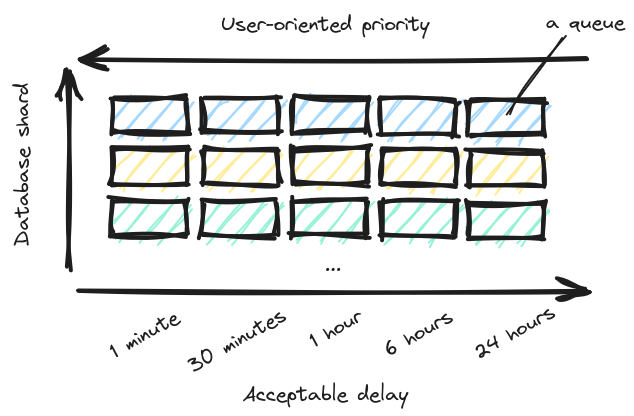
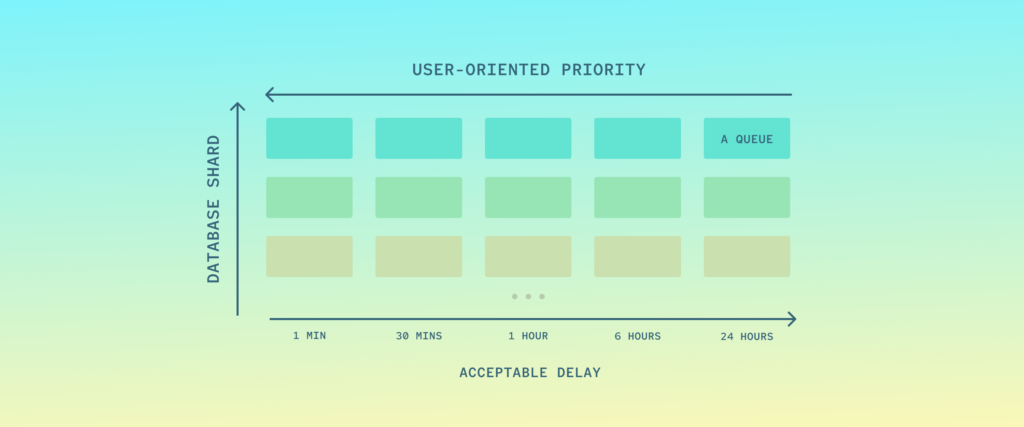
The diagram might seem complex — but in fact it’s nothing more than a couple of standard Sidekiq first-in-first-out (FIFO) queues (represented by rectangles). Each row represents queues for jobs that connect to one database shard. Each column represents a priority level, or in other words acceptable delay, or the SLO.
As a consequence of this setup each job must know 2 things when being pushed (created) — its importance for the user and the shard:
- The shard is easy, because it is determined by the account. Jobs operating on multiple shards can (and should) always be split into N independent jobs running on a single shard. By removing interdependence between shards, you achieve isolation of queues. Then if an incident happens, the impact to your system will be limited and you have achieved partial availability, which is better than full unavailability.
- The priority is trickier, because now the author/maintainer of a job class must think about how it will impact SLA. But also other questions, like how many such jobs might be pushed in a burst, what latency characteristics do the jobs have and so forth. To make this long-term maintainable, we created a documentation-heavy class with a sort of a questionnaire that enables developers to evaluate themselves, whether the job class fulfills criteria for higher priority queues.
Recently, we have also finished sharding our ingestion database to remove a single point of failure (SPOF) and as you can see now, it ties nicely in this design, distributing the load over the shards.
Measurement (SLI)
To match the job delay SLO per queue, we need to measure it and compare somehow. We collect the delay of the oldest job in a queue and send it to DataDog to generate insightful dashboards:
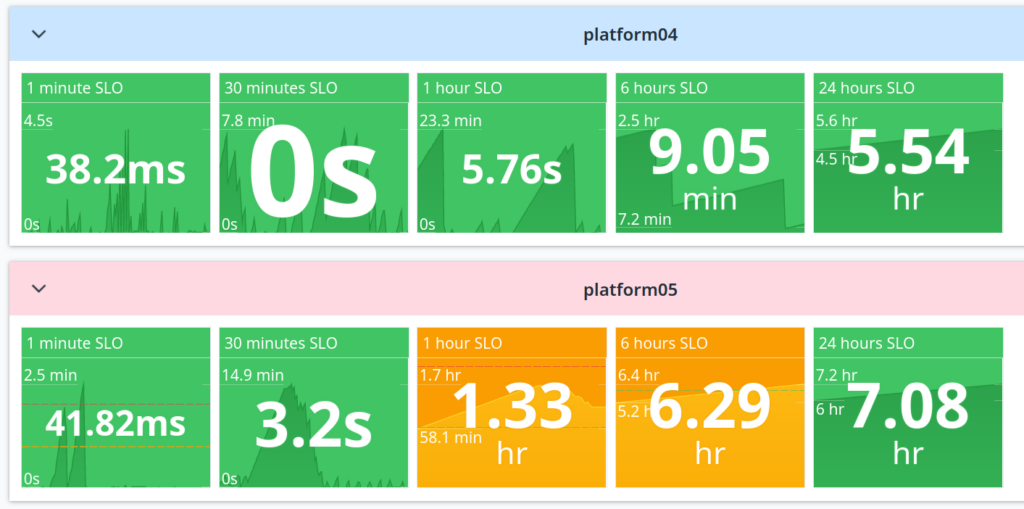
On this screenshot you can see two of our shards and their 5 queues each. Highest priority on the left, longest acceptable latency on the right. I picked this representation, because for each SLI it shows current value, but also the history and range of the value over a given period (an hour for example). That gives you a good idea of how the situation is developing.
When the latency breaches the SLO, the color changes to orange. And as you can see in this example, the shards are indeed isolated, allowing us to maintain SLOs elsewhere, even though shard 05 had issues with a large burst of jobs that we had to manually throttle. On the infrastructure side they also scale separately (see the next section).
I really like how this conveys information about the whole system inside one page with the possibility to drill down to details. If you’re looking for inspiration on how to make great readable charts, then The Visual Display of Quantitative Information by Edward Tufte is a must-read.
But eye candy is not the only purpose and even we at ChartMogul don’t have the whole day to stare at charts. We still want to be aware ASAP when something goes wrong, so when a delay reaches red (twice as expected), we trigger an on-call alarm. We could only do this once we became confident enough about fulfilling the SLO. That required a lot of optimization and refactoring of the jobs that now have to live up to higher standards.
But in reality this is not the only dashboard. We still need more that actually measure concrete complex operations from start to end throughout the different services & jobs. Those give better answers on such questions as how long does it take to process a webhook from receiving to showing a notification to the user.
Autoscaling
As I’ve already mentioned, we automatically scale the queue processing capacity, but how do we do it precisely? We leverage Horizontal Pod Autoscaling (HPA) that controls the number of pods inside an autoscaling group and prometheus that provides the latency metrics scraped using Sidekiq API.
We cannot scale the database easily, so there are limits on how many connections can be active through pgbouncer pools. But we can scale the processing capacity of Sidekiq, so that we pay for less Sidekiq threads and less node instances on AWS. Our current topology looks like this:
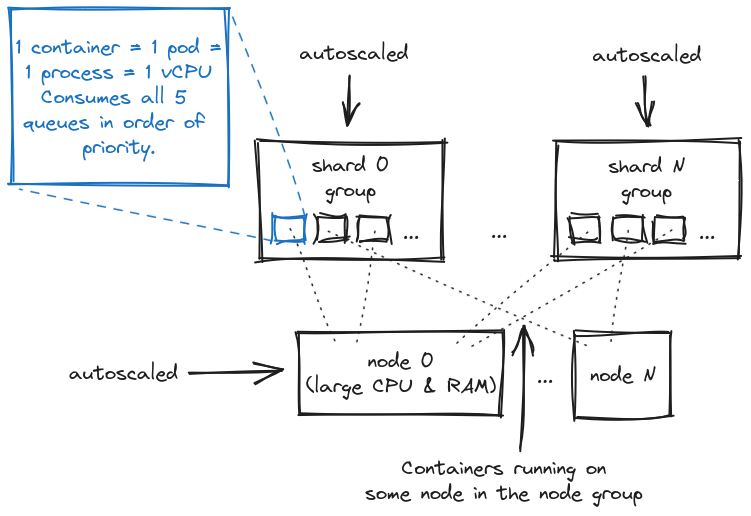
The number of containers in each shard group goes up and down as the demand by the accounts there changes. Meanwhile the number of nodes changes as well according to how many containers overall are required. There are some delays on both levels for practical reasons. For example to reduce disruption you need to tweak the autoscaling policy and introduce a graceful shutdown period.
Now, why did we choose the minimal containers? Each of our containers has just 1 vCPU and a limited amount of memory. This gives us greater flexibility, because we can shift processing capacity granularly, ie. by small increments. In other words, we don’t have to add or remove big virtual machines all the time. It also gives us transparent infrastructure metrics as we can directly observe the utilization of the vCPUs.
Threads and memory
Originally we had 20 threads per process. However, using DataDog APM Traces & Container monitoring we found out that the vCPUs were often close to 100 % during peak throughput and jobs took longer than necessary with suspicious gaps in traces. Those gaps were in fact the waiting of the ruby thread to get CPU time. So nowadays we settled on just 4 threads as it seems to be the best for our ratio of I/O wait to computation. Sidekiq’s default used to be higher, but it is now just 5.
A bigger container with multiple vCPUs, processes and large memory does have the advantage that occasional memory-hungry jobs still manage to finish without an out-of-memory kill… as long as they don’t throw a party on one container at the same time, that is. However, we opted to rather limit the impact of such jobs and either fix them or send them to a special quarantine queue with extra memory, but less capacity. This means the normal pods can stay lean and optimized for 99.9% of the jobs.
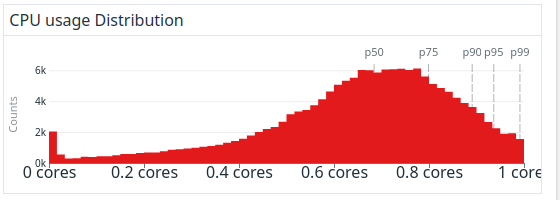
While the following long-term distribution doesn’t tell the whole story, it shows the balance we struck between perfect CPU utilization and minimal latency of jobs caused by CPU saturation:
Long-running jobs
Sidekiq has a self-protective mechanism against crashing jobs called poison pills. If jobs are detected to be present during multiple crashes, they’re not retried and marked directly as dead. We encountered this already with out of memory crashes (OOM). Such jobs can be usually optimized to prevent such errors. But it can also detect some jobs as false positives. And after we migrated to an autoscaled architecture, we realized this was happening to us, here’s why:
If you have autoscaling instances in the cloud, your jobs can’t rely on them existing “forever”. So it’s best if you can split the workload such that the jobs finish quickly. Let’s say our goal is 5 minutes. Then you can also set your graceful shutdown to respect this.
However, what if your job runs for hours and it’s hard to refactor? Well, we have put those in a special queue and on a container role that wasn’t autoscaled and we thought the job was done. But we still saw that the jobs were randomly killed, even without the graceful shutdown!
What we didn’t realize at first was that we put it together with other autoscaled containers on the same node group in Kubernetes, so sometimes it decided it was a good idea to reshuffle the long-running pods and unfortunately, right now Kubernetes doesn’t respect graceful period for this. In the end, we moved this job into a separate node group and also started refactoring the job.
One aspect that we could still improve in our design is perhaps not putting the 1 minute through 24 hours SLO queues on the same roles, as they’re mixing widely different latency expectations. So far we circumvented this problem by requiring 5 minutes latency in the 99th percentile for all jobs. But you can easily imagine with a thought experiment a large burst of 5-minute jobs would cause issues in the 1-minute queue quickly, we’ll discuss how we tackle this with rate limiting later on.
What about fair scheduling?
One of the struggle you encounter on a multi-tenant application with shared resources is the competition for these resources. Optimally, you want your application to feel fast for an account that needs to compute a lot of data, however you have to be careful not to starve other accounts:
resource starvation is a problem encountered in concurrent computing where a process is perpetually denied necessary resources to process its work.
— Starvation (computer science), Wikipedia
It’s an interesting problem, so let me go a bit deeper into it. We attempted to solve this puzzle once and for all in 2018 with a custom module for Sidekiq that introduced prioritized queues, it worked like this (green = jobs added, red = jobs removed):
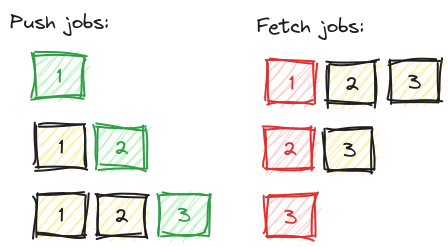
When inserting new jobs, they got into a subqueue per account ID. We kept track of how many jobs there were for an account. New jobs then got a higher score. We used Redis command ZPOPMIN to process the jobs with lowest score first. This works! Job done?
Unfortunately, no. On the face of it, this algorithm is very fair to all accounts (at least in regards to number of jobs). However it has pitfalls. First let’s see the example where the queue stops working as FIFO:
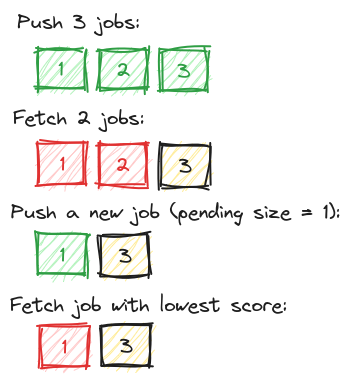
As you can see, the newest job gets processed first, breaking the FIFO expectation. This is not terrible if you consider retries for example, you must prepare the jobs to process out of order. But it makes it harder to reason about when a particular job would be processed. The worse part is that this applied on all the accounts, so if an account reached a high number of jobs, eg. 50000+, such jobs could get stuck there until there was literally nothing else to do.
Throttling & rate limiting
Nowadays we solve this issue with two out-of-the-box mechanisms instead:
- throttling: on large workloads we limit how many jobs we push. This can be done for example with Sidekiq Batch, where you push a 1000 jobs, then push next batch of 1000 when these had a chance to process. That way you always leave some capacity for other accounts. Be sure to use perform_bulk (and save 999 roundtrips to Redis). Alternatively, we also throttle how many we push per minute per account, but that can still lead to saturation if the jobs take longer than expected to process.
- rate limiting: when the jobs are already running (or waiting in the queues), you can check against a quota, whether they’re not using excessive resources. And in that case you make them retry later (with exponential backoff). There are multiple algorithms supported in Sidekiq. You can count number of jobs, number of requests to 3rd party APIs or any other metric you can measure. Sidekiq 7.1 introduced a leaky bucket points-based limiter. So it’s possible for example to measure the duration of jobs and assign maximum to each account, or even give on-call developers the ability to dynamically lower in case of unexpected issues. This can be really handy in case the jobs are not numerous, but take unexpectedly long time to process.
Combining these two approaches provides smoothing of bursts along multiple dimensions and makes the system more stable without manual interventions. The downside is more load on Redis, but if these features are not used excessively, it is actually very low.
Conclusion
We started with a system that emerged organically and we didn’t understand it very well. It caused issues and hours-long unnecessary latencies. After we analyzed the issues, we realized it was necessary to better understand the framework itself (read a book) and our system’s scalability.
It turned out to be the right choice, because we managed to squeeze more performance from similar hardware, benefiting from boosted capacity during peak load. Our application is also increasing throughput of jobs, while we dramatically reduced incidents. All this while not migrating to another framework or language, which saved significant costs of learning new technologies.
We learned to better understand the jobs that we run in the cloud, measuring latency instead of queue length. We started bridging the gap between users and the system, optimizing for efficient usage of our main bottleneck — the database — but also for better user experience (lower latency on important jobs).
As a result, we have gained greater partial availability, limiting the impact of issues, and we intend to apply similar approach to other parts of our web service as well. There are now guidelines and an easy-to-understand system for adding new jobs, eliminating the need to add new special queues for special features. Now, we have a much better insight into the health of the system and with the new operational tools we are better equipped to handle unforeseen circumstances. All of this makes the user experience better, but it also makes developers’ lives easier and gives us more time to focus on developing features.