How To Inspect A Website In Any Browser [Chrome, Safari, Firefox]
![How To Inspect A Website In Any Browser [Chrome, Safari, Firefox]](https://cyberedtechs.com/wp-content/uploads/2023/12/How-To-Inspect-A-Website-In-Any-Browser-Chrome-Safari.jpg)
Think of the internet as a giant iceberg. The average user only sees the tip of the surface: the website interfaces shown on our screens, but every webpage rests on massive foundations of code.
Lines and lines of HTML, CSS, and JavaScript synthesize to construct the experiences we mindlessly scroll and tap through daily.
What if you could peek behind the curtain?
The ability to inspect website code lives directly inside your browser. Today’s popular browsers like Chrome, Firefox, and Safari contain built-in developer tools with the Inspect Element feature that helps you play around with the front-end technologies of any web page.
This guide will teach you how to access and use the Inspect Element feature in all three browsers. We’ll also discuss what we can achieve using these browsers’ developer tools and how Inspect Element helps.
Let’s dive right in!
What Is Inspect Element?
Inspect Element is a utility, usually found within your browser’s developer tools, that lets you view and manipulate the code — HTML, CSS, and JavaScript — that constructs any webpage.
When you open Inspect Element, it shows you various code segments that build the website.
You can highlight page sections to reveal the corresponding source code. Alternatively, clicking on a line of the original source code will highlight its matching visual element on the rendered page. This linking of front-end code and design lets you understand how websites are built.
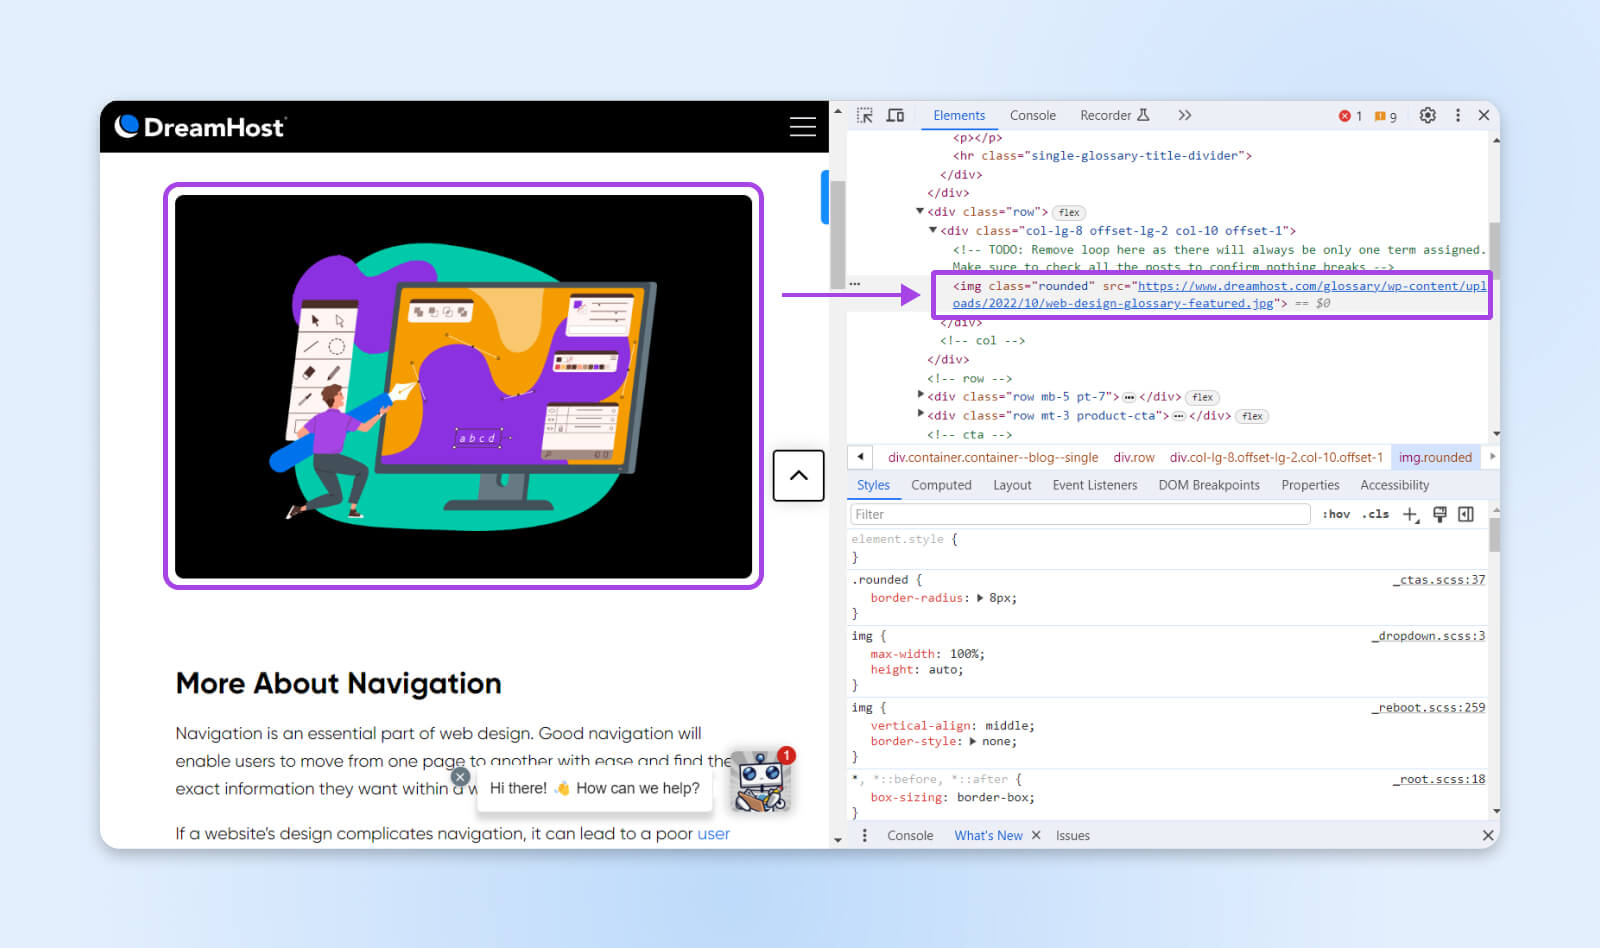
Nerd Note: Inspect Element allows digital marketers to see how specific changes will affect the appearance of a web page without making any changes to the live site. This can help test new CTA buttons, drop-down menus, color schemes, and other design elements. You can even see if your website is responsive on different devices.
You can tweak text content, colors, fonts, layouts, animations, and more, to preview changes. The webpage remains unaltered externally, and refreshing returns your local view to the original state.
Who Is It For?
While Inspect Element is primarily considered a web developer tool, its practical uses span beyond coding. Here’s how various roles can benefit:
- Developers: Debug layout issues, test code edit, and improve site performance.
- Designers: Visualize new style ideas and preview designs across devices.
- Marketers: Check SEO data, export icons/images, and modify text locally.
- Writers: Anonymize screenshots and locally edit articles.
- Support: Identify problems for documentation.
- Students: Learn the implementation of web technologies.
Essentially, anyone involved with websites whether it’s building, designing, running, writing about, or just using them, can discover new perspectives through inspection.
Let’s look at exactly why you should start inspecting elements on the web.
Why Inspect Websites?
Let’s explore the key functions of the Inspect Element feature to understand how websites are constructed.
1. Debug And Fix Problems
Finding and fixing bugs is a massive use case for inspection tools. Developers can dive into the code to troubleshoot when a website appears broken to determine if it’s an issue with styling, layout, responsiveness, etc.
Elements causing errors on the page are visually displayed in the inspector, allowing developers to narrow down the issue code quickly.
Since values can be tweaked live to non-destructively test fixes, it becomes easy to find the fix.
Inspection tools also provide access to the Console panel. This allows for more advanced debugging and running custom JavaScript to see how the page reacts.
So when tackling front-end and back-end website bugs, Inspect Element gives the power to unravel where problems originate.
2. Understand Web Development
For new developers still learning HTML, CSS, or JavaScript, inspector tools greatly assist the learning process. Inspect Element lets you see professional implementations of what you’re trying to achieve on your website. Ultimately, helping improve your implementation.
You can also test how changing elements and content in HTML impacts the page.

For example, adjusting margin values to observe spacing shifts or targeted nested elements using CSS descendant selectors. The real-world context also sticks better than reading through textbook examples.
Plus, seeing how expert web developers structure and optimize sites provides a blueprint for coding your pages. The ability to experiment coupled with viewable source code from popular sites facilitates rapid growth.
3. Test Designs and Content
Web designers frequently use inspector tools to mock up style changes quickly. Testing variations — like new fonts, resized elements, color palettes, etc. — can be done instantly without affecting production code.
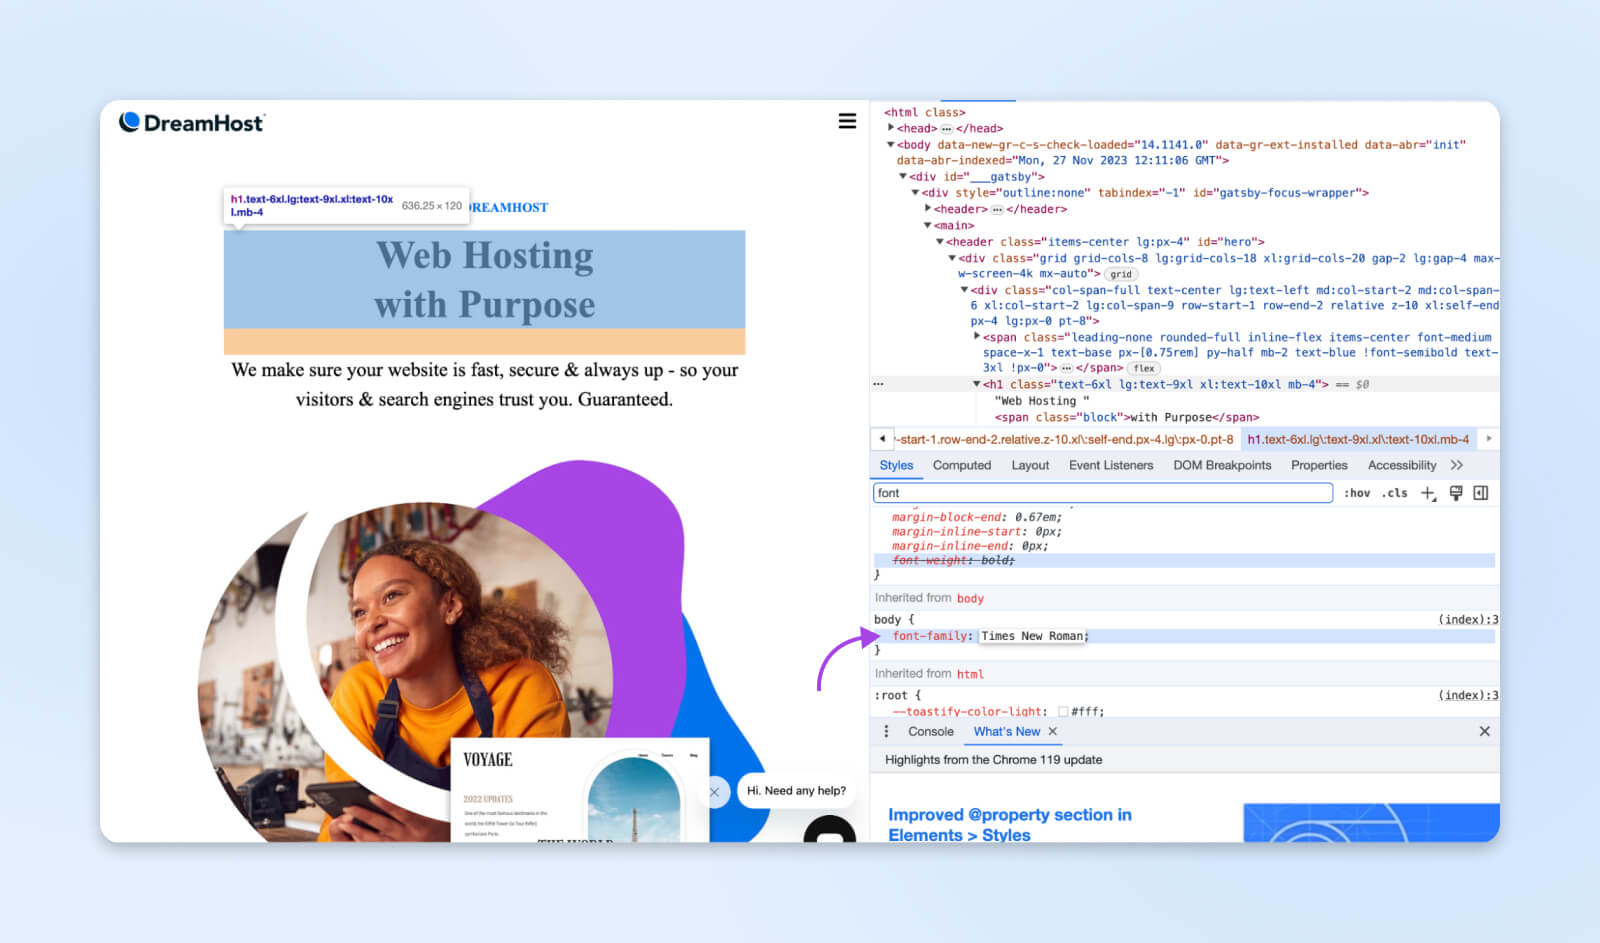
For example, compare typefaces to determine ideal readability or change the button colors to see what they look like. With Inspect Element tools, you can do that right within your browser instead of making the changes in an external device like Photoshop or Figma.
Similarly, for writers and marketers, modifying text locally helps preview content and layout adjustments. From testing paragraph widths to inspecting metadata, easy editing without needing access to Content Management System (CMS) backends is valuable.
Content Management System (CMS)
A Content Management System (CMS) is a software or application that provides a user-friendly interface for you to design, create, manage, and publish content.
Read More
4. View SEO Data
Browser developer tools provide vital insights when considering a web page’s SEO and social meta. Examining meta tags — descriptions, titles, open graph tags — most crucially influences how links appear in SERPs and when shared.
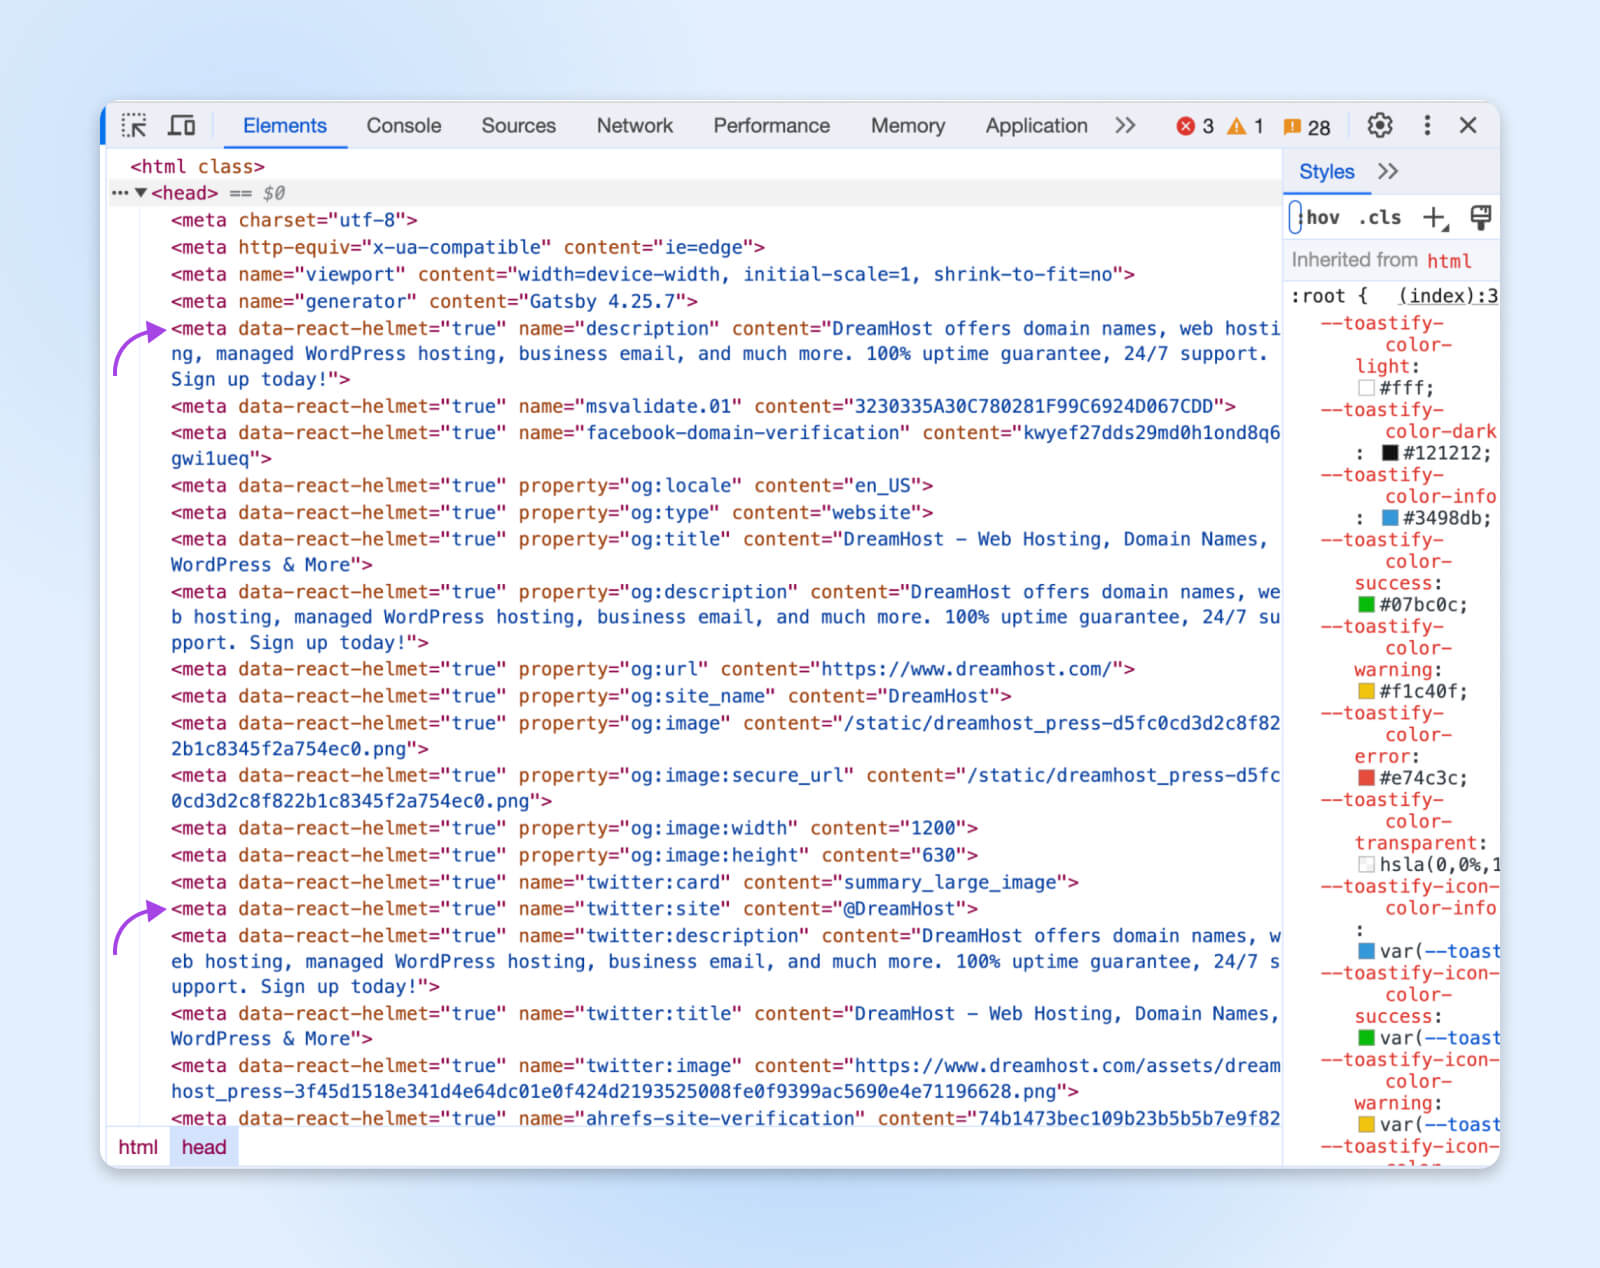
For example, most social networks read the og:title og:description. All this information is in a website’s <head> elements.
5. Check Performance
Inspect Element tools also cater to web performance audits for improving overall site speed and loading behavior. In Chrome, the Network tab will give you a load timeline, which includes how long each element took.
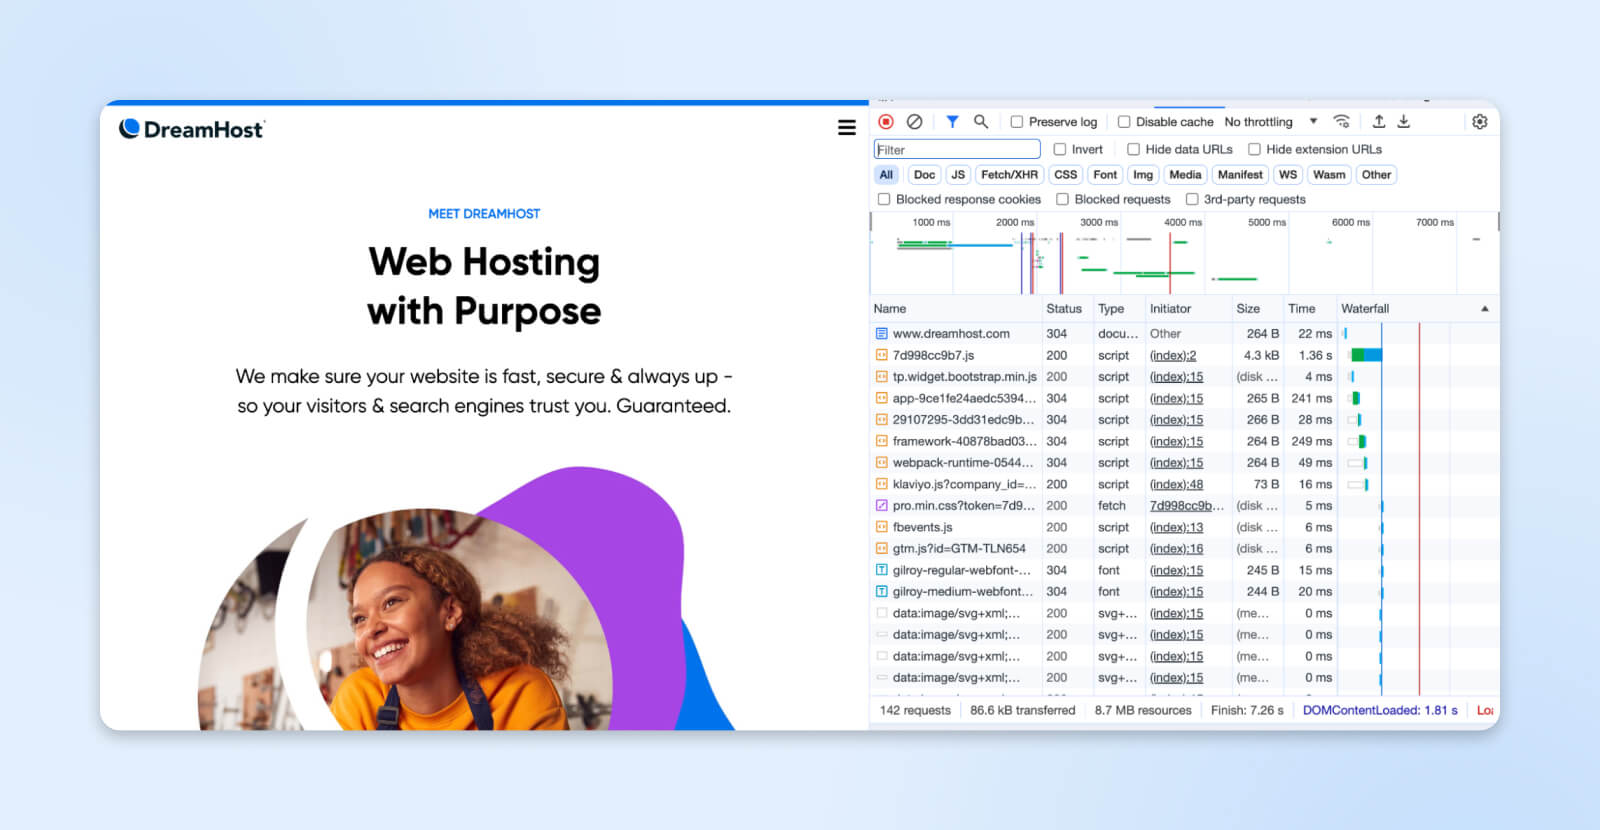
When inspecting pages, you can view total download times and resource requests and break this data into individual elements. Find out which images, fonts, or JavaScript files drag down performance. Then, address the issues directly: compress assets, implement caches, and defer nonessential scripts.
Network inspection also allows throttling to mimic slow connections on mobile or poor wifi. Discover usability flaws by measuring loading times across simulated connections. Are pages still functional on 3G? Do some files block rendering? This information can help you improve your overall website page speed.
6. And More
This just scratches the surface of what’s possible through Inspect Element. We’ve mainly focused on use cases for developers, but designers, writers, and marketers can accomplish many goals discussed prior without coding expertise. You’ll also find analyzing accessibility and security vulnerabilities often leverages inspection capabilities.
Now that you hopefully better understand all you can achieve by inspecting web pages, let’s quickly look at how these tools work before jumping into practical walkthroughs.
How Browser Developer Tools Work
The core of all major browser Inspect Element interfaces revolves around the Document Object Model (DOM).
When a web page loads, the browser processes markup (HTML), presentation (CSS), and logic (JavaScript) to construct a DOM instance.
The DOM essentially represents the page structure as a tree of parent-child node elements. Developers can instantly interact with this live representation using inspector tools to read, edit, and visualize corresponding changes.
So when you toggle CSS declarations on and off while inspecting, rewrite conditional logic, or hide specific HTML nodes, for example, the matching DOM nodes update in real-time. This is how alterations display live without actually changing any source files externally.
Behind the scenes, browsers apply changes made through inspection tools by temporarily overriding the default CSS and HTML. These modifications only exist for your browser and revert to normal once you refresh the page (or just close the tab and come back later).
Inspecting Elements In Google Chrome
As one of the world’s most popular browsers today, Google Chrome, accounting for over 70% of the browser market share, is equipped for nearly any inspection needed out of the box.
Pressing Ctrl+Shift+I (Windows) or Command+Option+I (Mac) instantly launches Chrome’s DevTools interface to analyze any available webpage or web app. You can also inspect specific elements on the page.
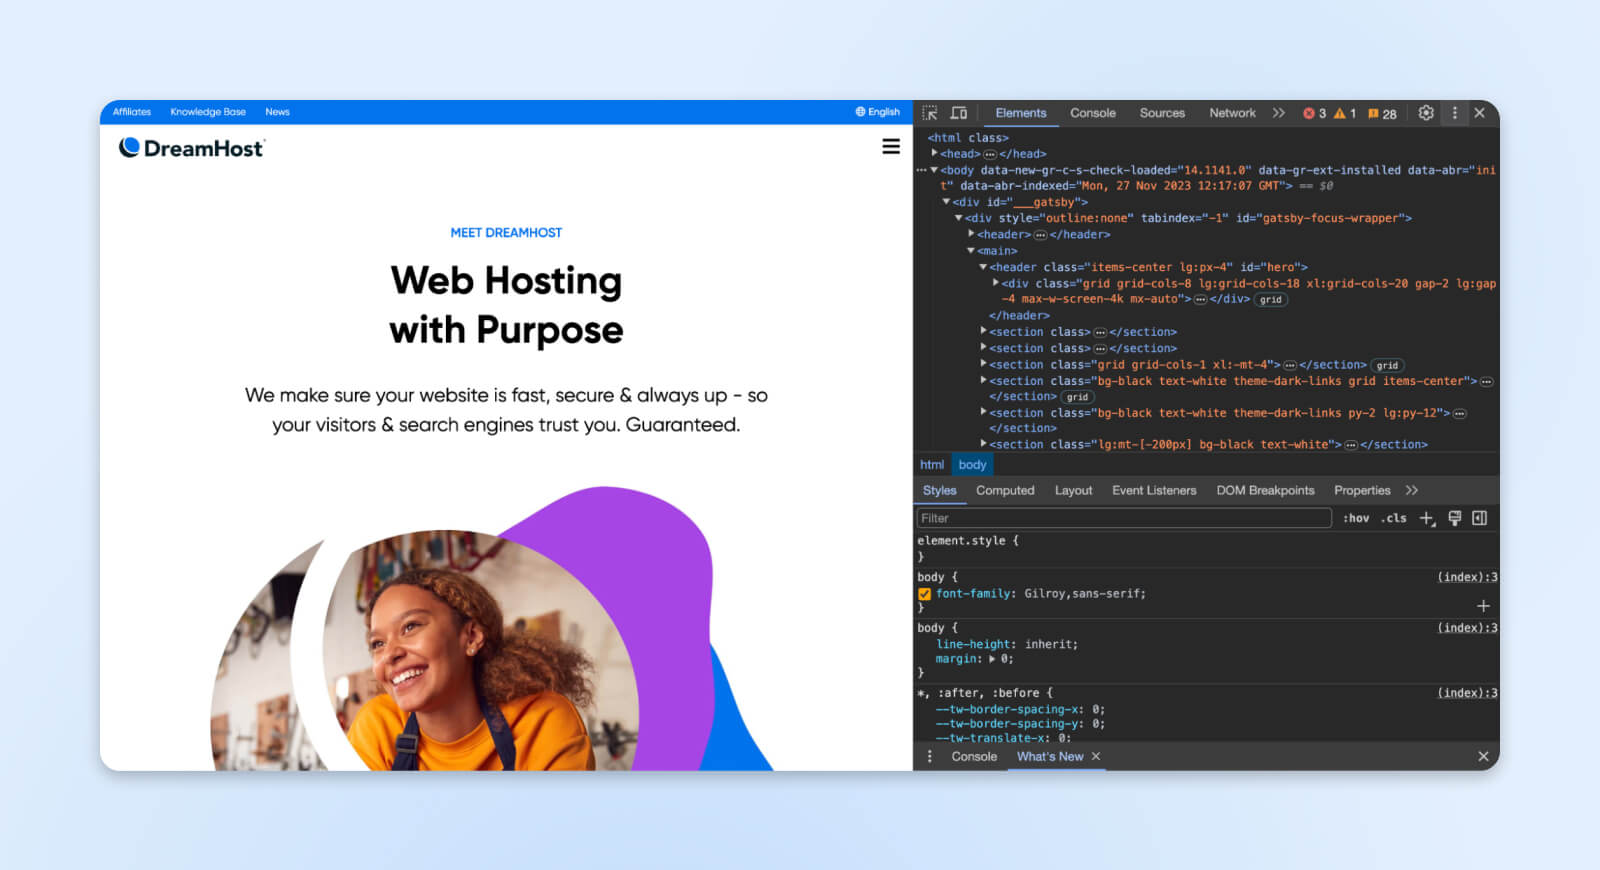
Let’s break down how to access Chrome’s Inspector, navigate page elements efficiently, and test joint manipulations – from editing text to simulating mobile devices, touchscreen devices, and more. You can use the phone icon on the top-left corner of the console window.
1. Open Developer Tools
Start by navigating Chrome (or any Chromium-based browser) to any webpage you want to inspect. Right-click anywhere on the page and select Inspect from the context menu.
Alternatively, use the above keyboard shortcut.
DevTools appears docked at the bottom of your browser window on larger screens as default. You can open it as a separate window or change docking locations, too — click on the three vertical dots in the upper-right corner of the Inspect Element window.
Wherever it renders, the first thing you’ll see is the main elements panel which shows all the HTML code.
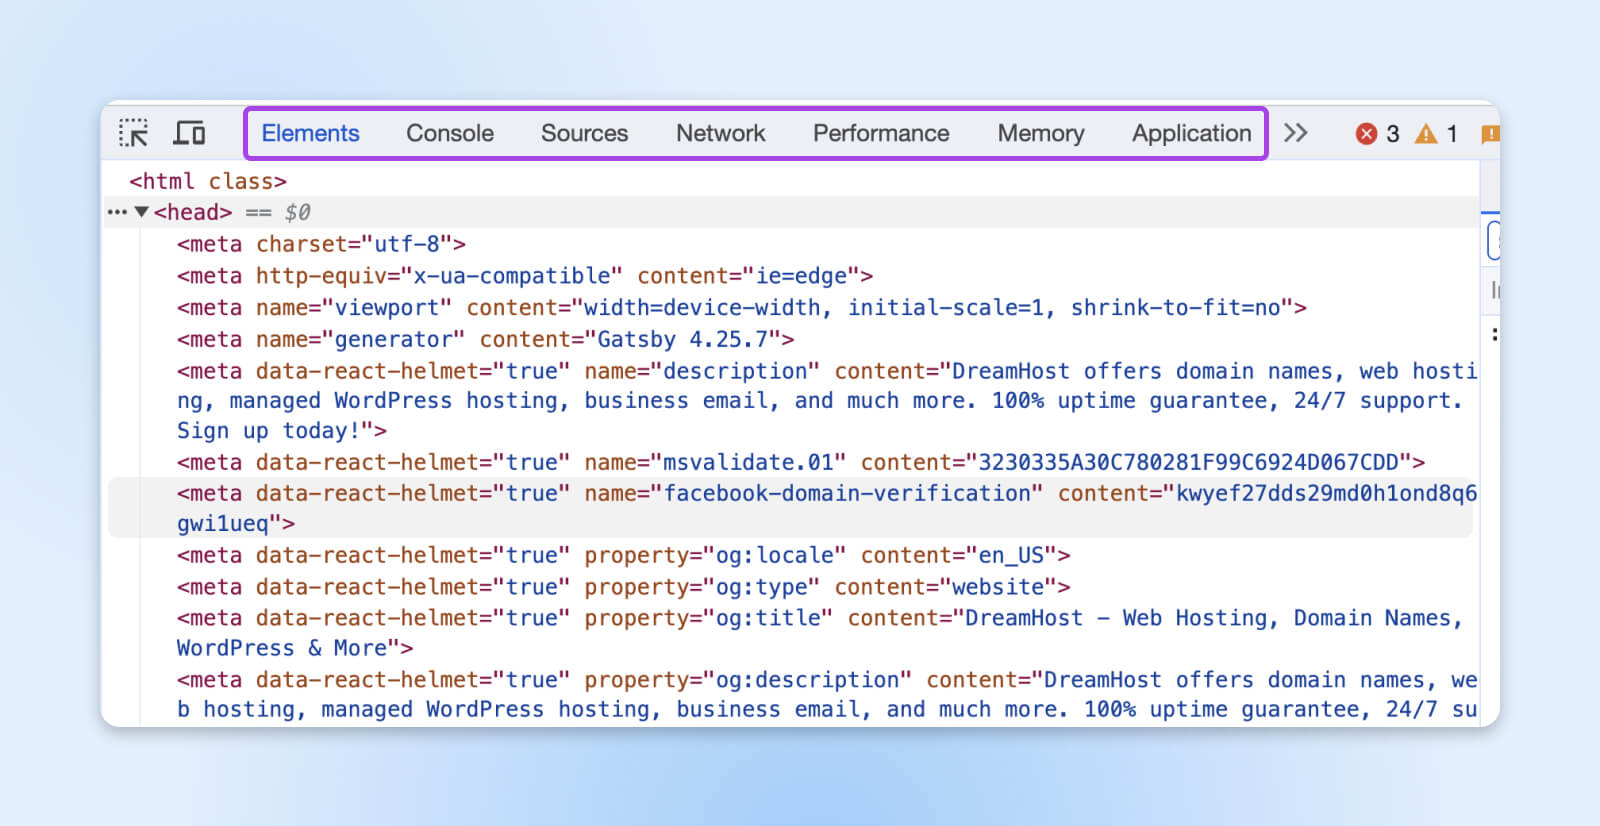
Various other analysis tabs can be accessed across the top: Console, Sources, Network, etc.
Depending on where the Inspect element window opens, one portion will show the page source code starting with <html>. As you click on different things in the code, the right (or lower) side shows the styles, including fonts, colors, margins, paddings, etc.
This linking between code and appearance facilitates understanding and experimenting with changes. But before manipulating anything, let’s see how to target elements for inspection efficiently.
2. Find Elements To Inspect
As pages grow long and complex, scanning visually for the element you want and locating its code in dev tools can become tedious. Instead, use the node selection tool.
In Chrome DevTools, click the icon on the top-left corner (of the inspector window) that resembles the selector crossed with the cursor (or press Ctrl/Cmd+Shift+C).
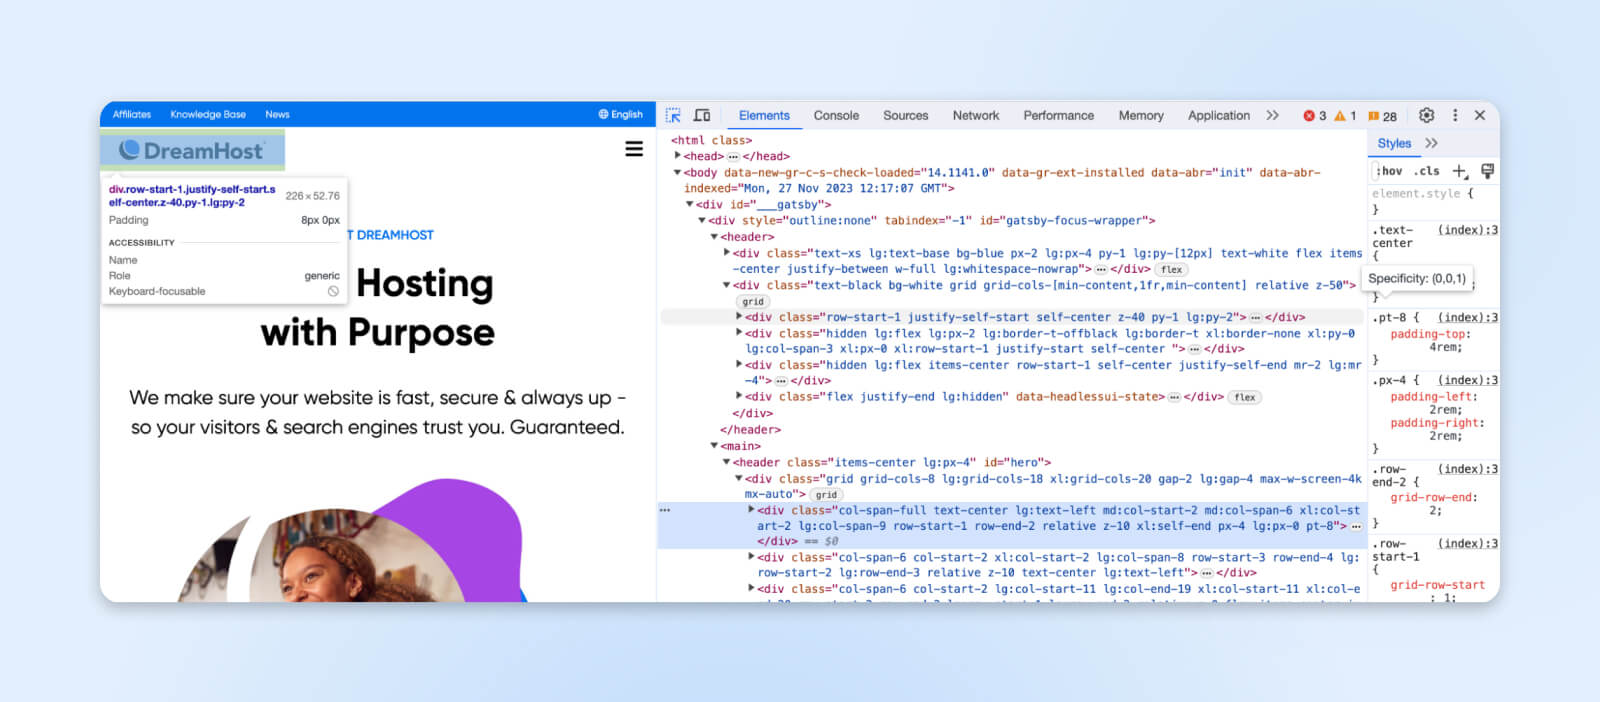
Your mouse now toggles element selection mode. Hover over any visual entity on the page and notice how the inspector code automatically highlights its DOM node.
Now, clicking any element on the page will directly highlight the code that makes the element appear on the page. You can also see the styles right or below the HTML code. You can also use the search box or search tab to find elements. Alternatively, Ctrl+F (Windows) and Cmd+F (Mac) work too!
Let’s see what we can edit with the elements selected.
3. Interact With The DOM
The inspect element feature also provides a way of interacting with the Document Object Model (DOM) — the structured representation of page elements visible in the editor.
Developers can leverage the DOM to reshape content, style, and interactivity directly within Chrome DevTools.
Some common ways to manipulate elements include:
- Editing text by making content fields directly editable.
- Toggling CSS styles like colors and fonts to visually test styling changes in the CSS panel.
- Modifying component attributes like links and buttons to reshape functionality.
- Rearranging structural elements to prototype alternative layouts.
The DOM updates live with changes made in the inspector view. So any tweaks preview instantly in the browser, then reset upon refresh, making experiments low risk during development.
4. Test Responsiveness
Beyond editing individual elements, inspector tools also provide environments to test responsiveness across a variety of devices and viewports.
Chrome DevTools includes device mode simulation. You can select presets to emulate standard phone or tablet resolutions and touch capabilities. Or use the more advanced options to manually configure exact dimensions, pixel ratios, CPU throttling, and other metrics.
This allows rapid validation of aspects like:
- Layouts at various breakpoints.
- Touch target spacing for mobile users.
- Site performance on low-powered devices.
- Accessibility on different hardware.
The ability to preview pages on simulated mobile screens during development helps perfect responsiveness and progressive enhancement delivery. Testing across a wide spectrum of emulated devices ensures broad browser and device support.
Inspecting Elements In Firefox
Firefox provides its webpage inspection tools rivaling the functionality of Chrome DevTools. Access Firefox Inspector using the same Inspect Element shortcuts as Chrome: Ctrl+Shift+I (Windows) and Cmd+Opt+I (Mac).
You can also use the keyboard shortcut Ctrl+Shift+C (Windows) and Cmd+Opt+C (Mac) to open the inspect element panel, allowing you to click on an element on the page to jump to the code directly.
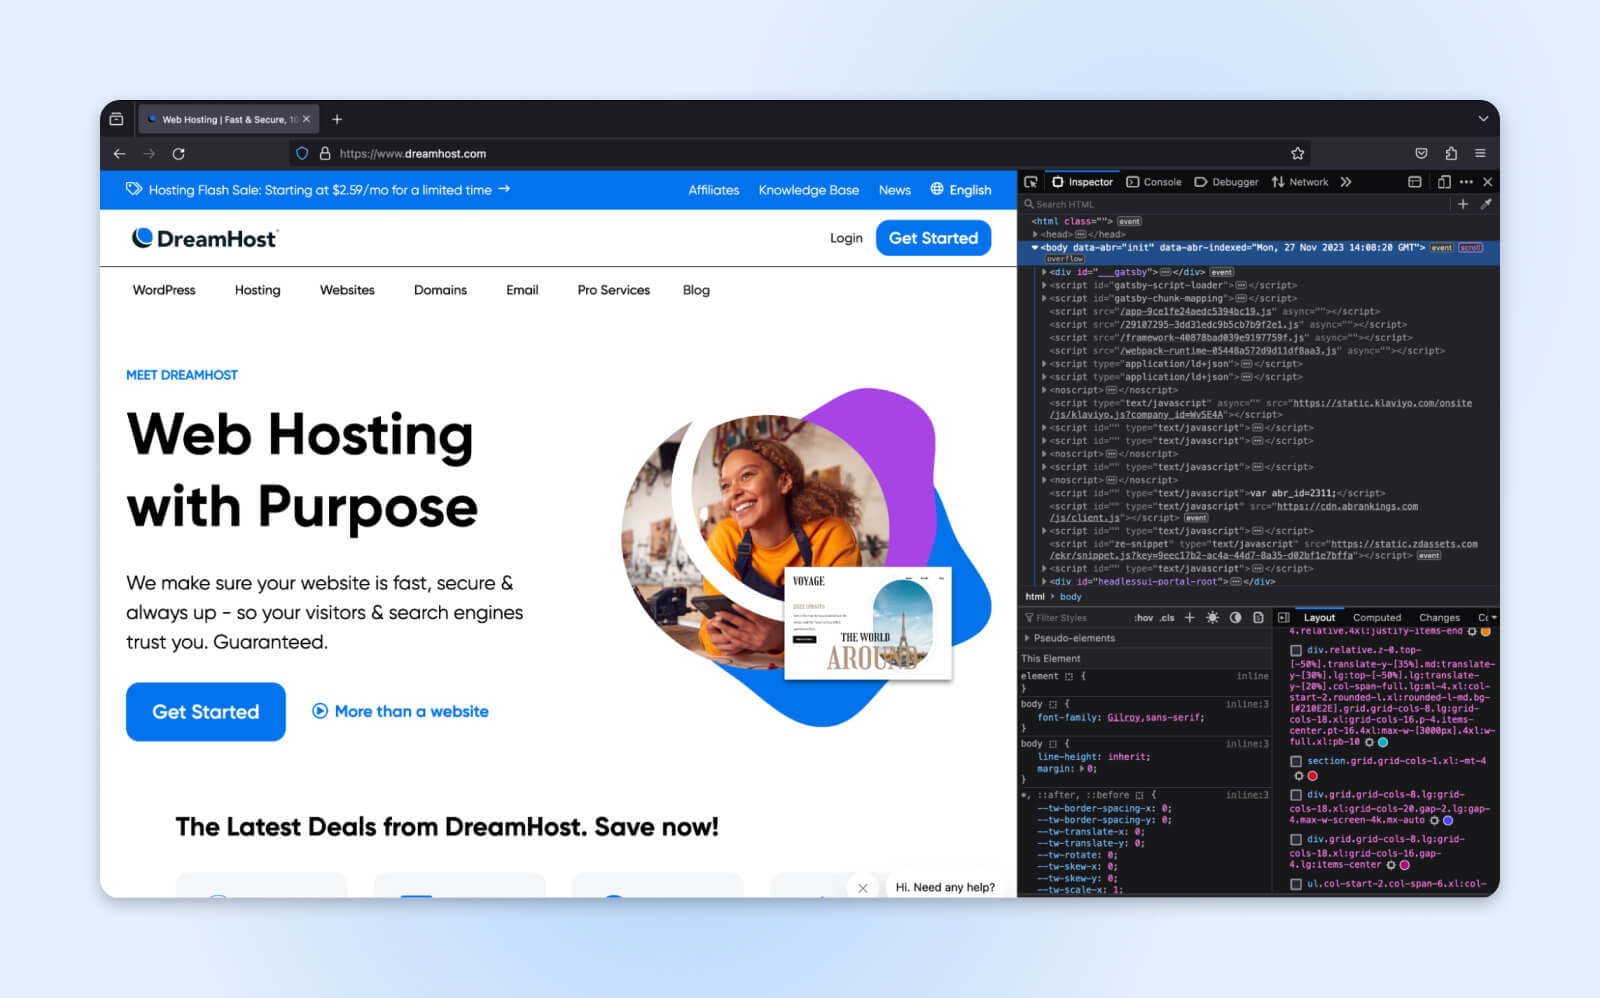
1. View DOM Attributes
When analyzing complex interfaces, focus states and dynamic effects rely on HTML attributes instead of CSS. Right-click any element within Inspector views and choose Show DOM Properties.
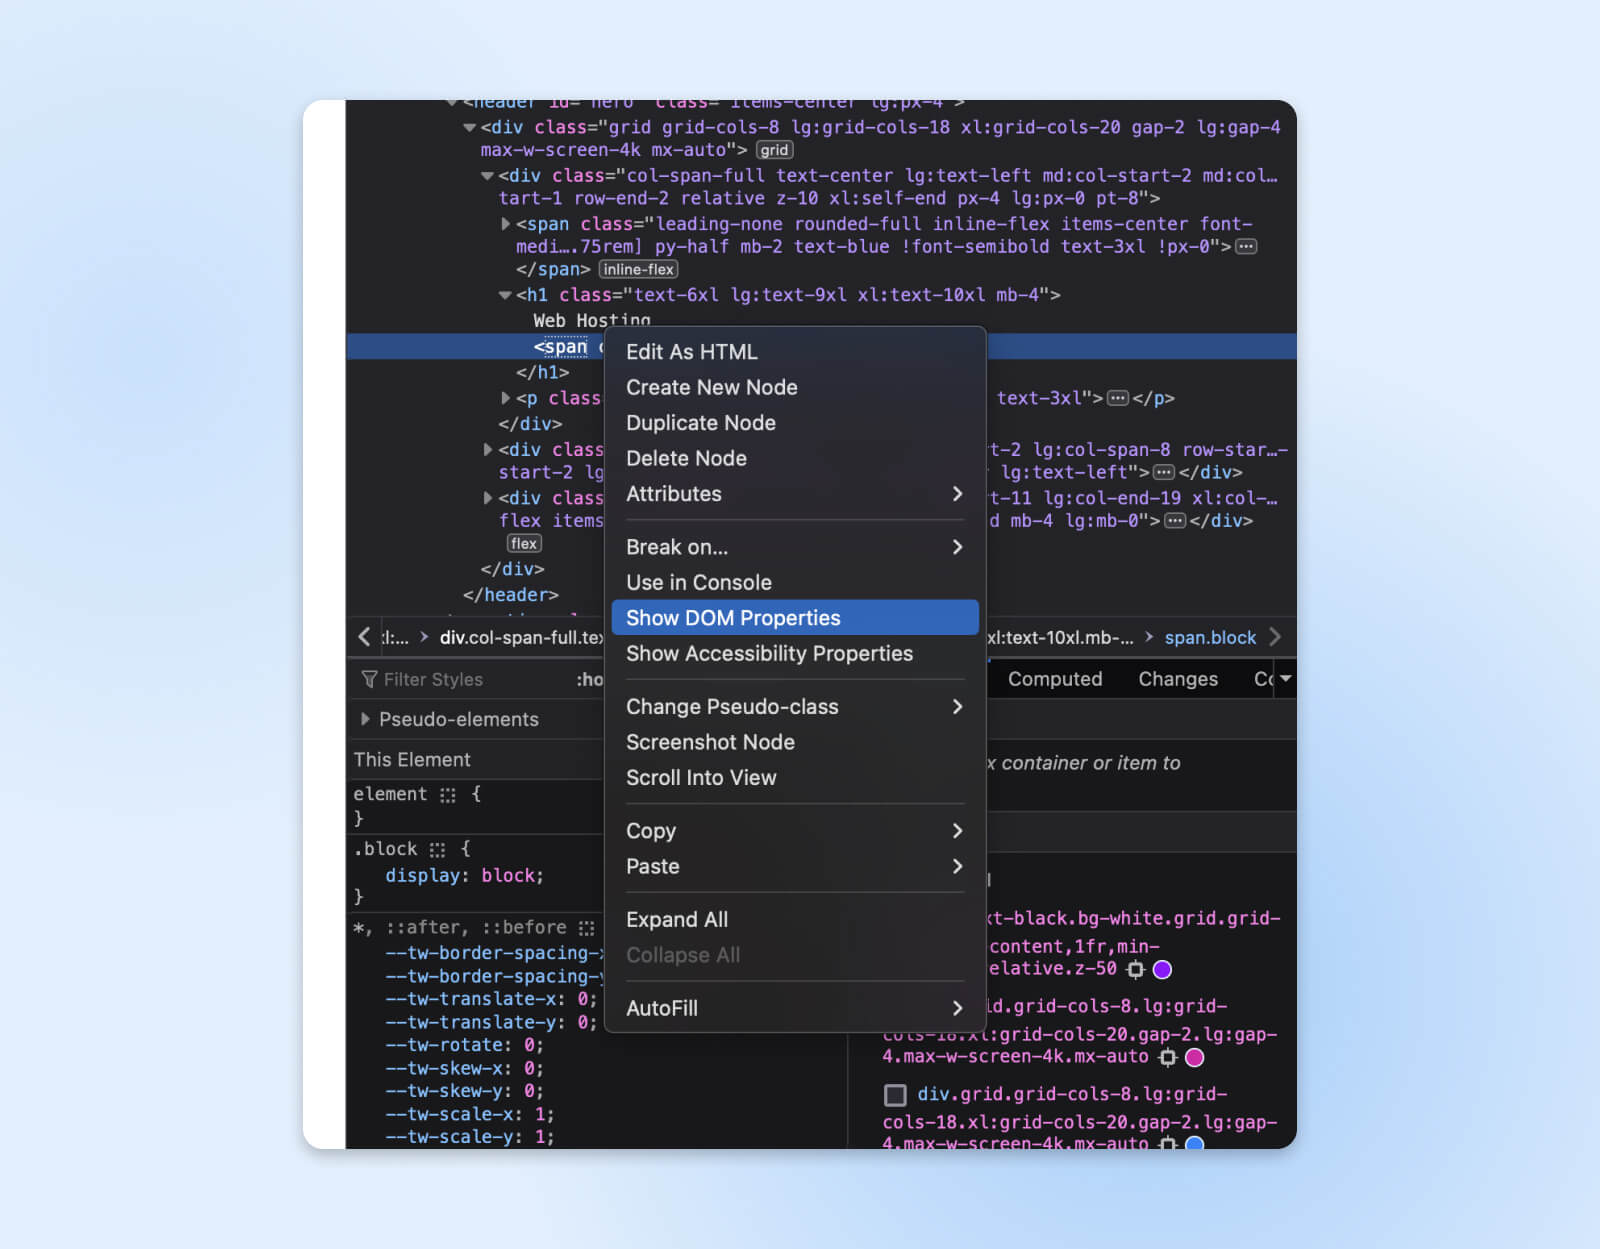
This displays all native attributes associated with the node. You can directly edit values here to modify component behavior through the Inspector rather than requiring code changes.
For example, adjusting the range slider min/max and step increments visually sets bounds, changing the checkbox/radio button names groups toggles, overwriting dataset properties hooks different remote data, and the list goes on and on.
2. Work Visually With Box Model Diagrams
Firefox eases inspection by showing the padding, borders, and margins right as you move your cursor around the website.

When clicking any node, the Inspector panel cycles between three states: geometry off, box model overlay only, and both overlay plus markup outlines.
This can be useful when you want to test if your spacing, padding, and margins have been appropriately applied to the elements.
It also makes it more straightforward to fix any issues since you can click through specific elements and see precisely what CSS styling is affecting them. Geometric analysis here can help beginners grasp spatial relationships faster.
3. Edit Colors With A Color Picker
Within Inspector, click any color swatch next to any property accepting colors like background, border, etc. It’ll show you a color slider, alpha setting, and a color picker to pull colors from your open page.

You no longer need to spend time guessing color codes or checking your design assets for the code being used. Pick it from existing elements or even images on the page.
Inspecting Elements in Safari
Safari offers the Webkit Inspector for inspecting pages on macOS systems primarily. However, you need to enable the development menu before accessing it.
Open Safari and click Safari from the Menu > Settings > Advanced. Check the box for “Show features for web developers.”
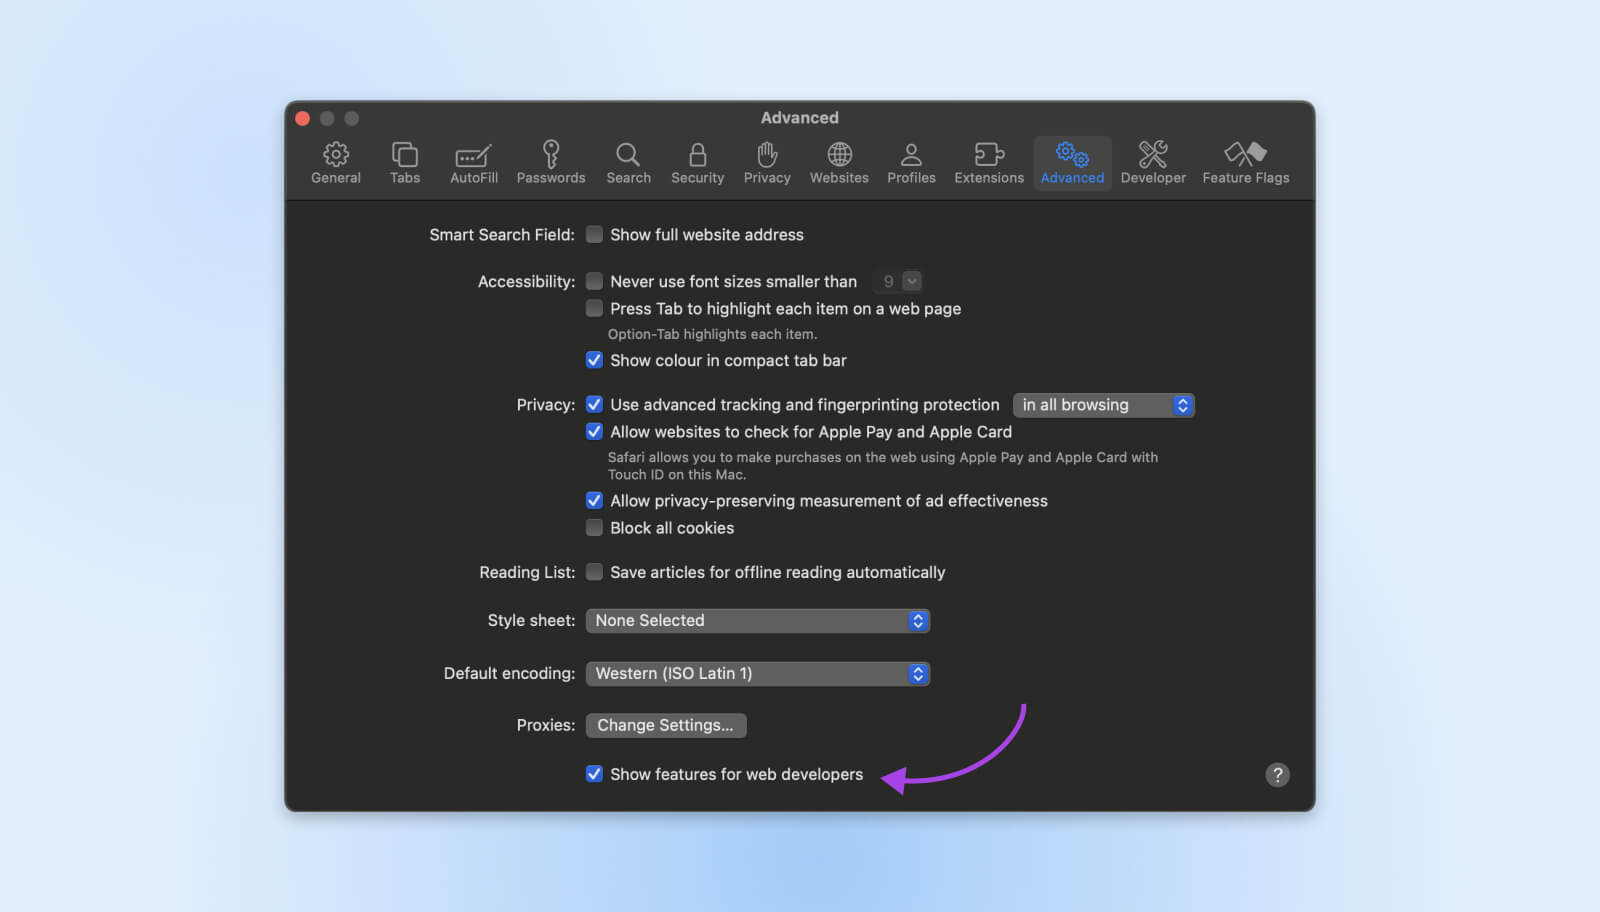
Now you can visit any website and right-click to see the “Inspect element” option available,
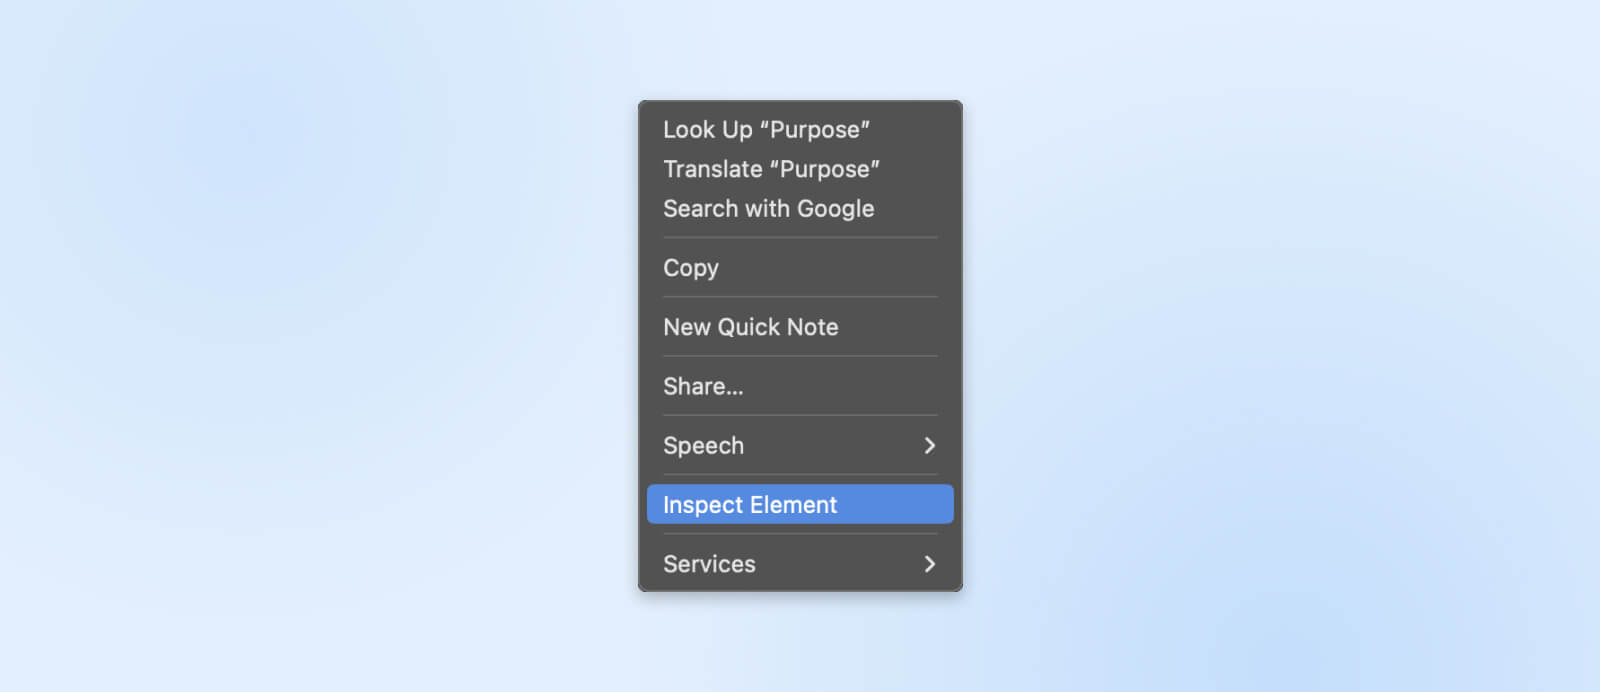
You can also use the keyboard shortcut, Cmd+Opt+C, to access the Inspect Element feature.
Timelines And Network Speed
Similar to most other browsers, Safari offers powerful timelines within the Safari Inspector. The resources list helps you instantly identify which files are causing rendering delays and what the reason could be. You can also see what scripts are blocking the page load.
3D View Of Website Layers
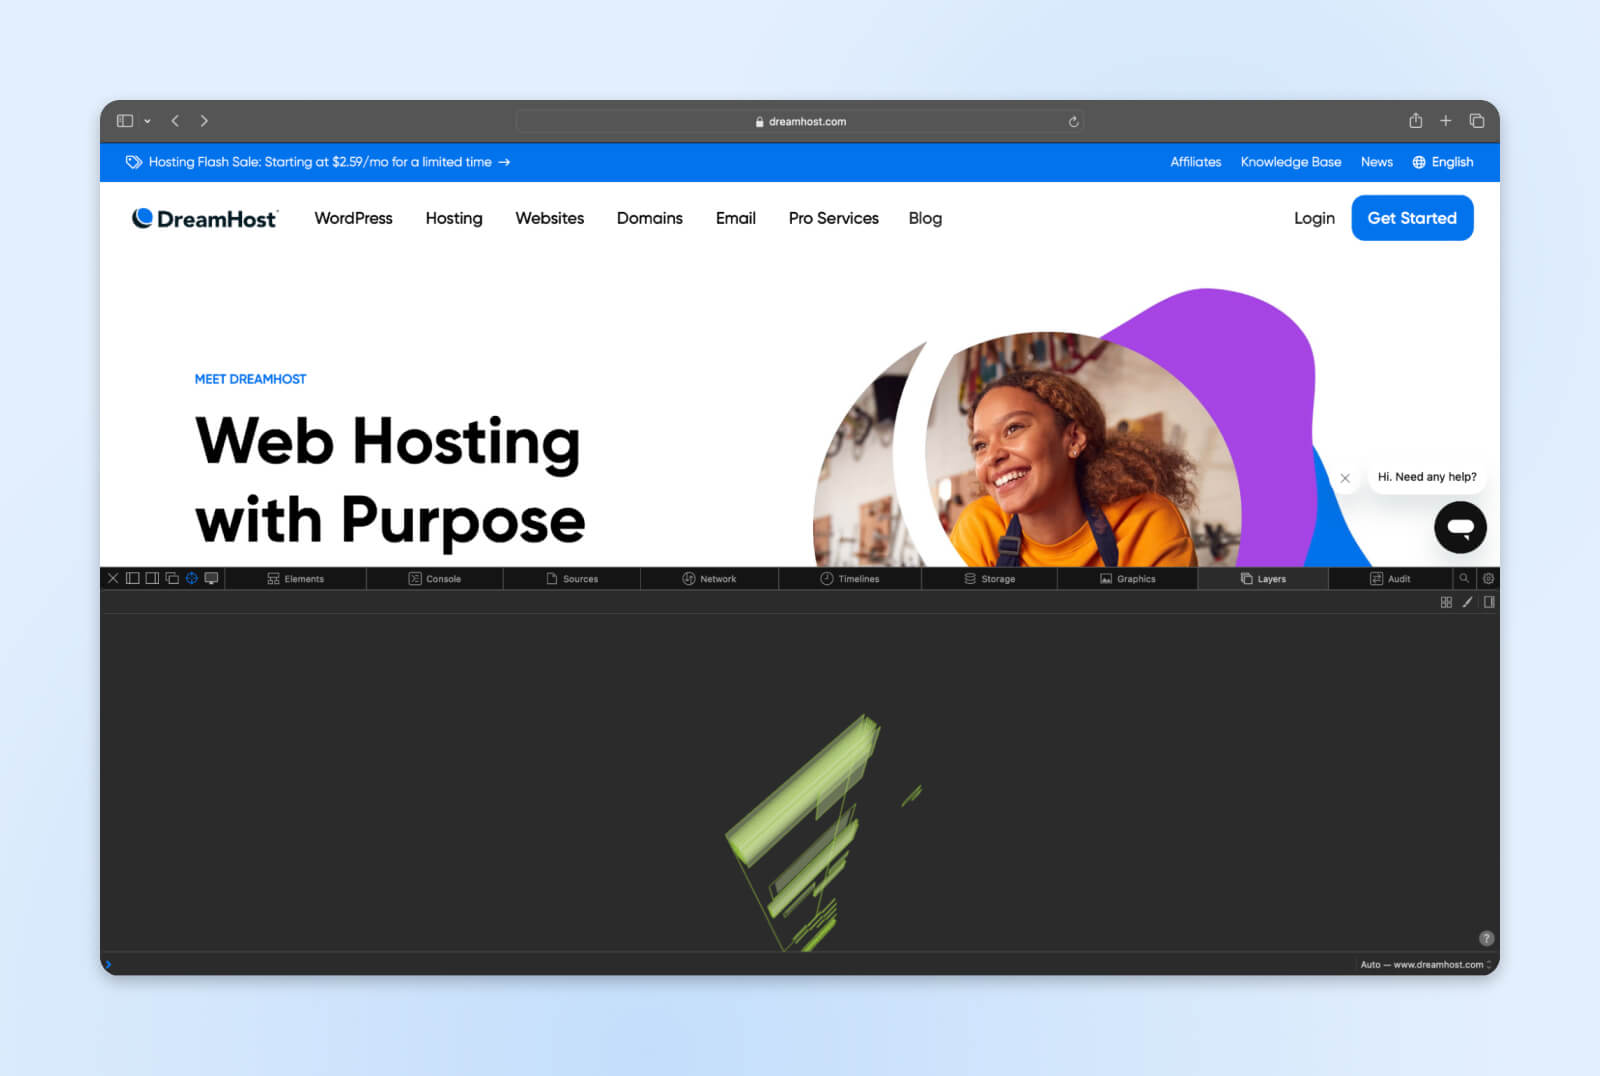
If you want to analyze the layers that make up the website, simply go to the Layers tab and you’ll be presented with a full 3D model of all the layers
Ways To Use Inspect Element
Now that we’ve set up inspector tools let’s discuss some practical ways they can be used. Here are just a few common usage examples:
Change Text Or Images
One helpful capability is modifying textual content or image assets directly within the editor. You can tweak headlines, swap logos, anonymize details, and more.
To edit any text or images, inspect the element you want to change first, then double-click within its bounds in the code editor to make the content editable.
Input anything you want, and press enter to make the changes live (temporarily).
Change Colors, Fonts, And Styling
When inspecting various elements like links, buttons, menus, or galleries — you’ll notice attributes that define associated behavior like href destination URLs, carousel view box data sources, and more.
Much like editing textual content and CSS properties and style sheets, these HTML-level traits can be manipulated directly within Inspector.
The DOM updates these changes on the spot. So you can immediately see how the changes reshape component functionality without coding:
- Modify the href of links and buttons to redirect clicks elsewhere temporarily.
- Adjust tab role and aria tags to test accessibility improvements.
- Swap thumbnail image src attributes while building galleries.
Change Element State
Beyond basic styling, Inspector tools also allow modifying interactive element states like hover, focus, and active. Right-click elements and use the Force state options (Google Chrome) to visualize how components appear during usage.
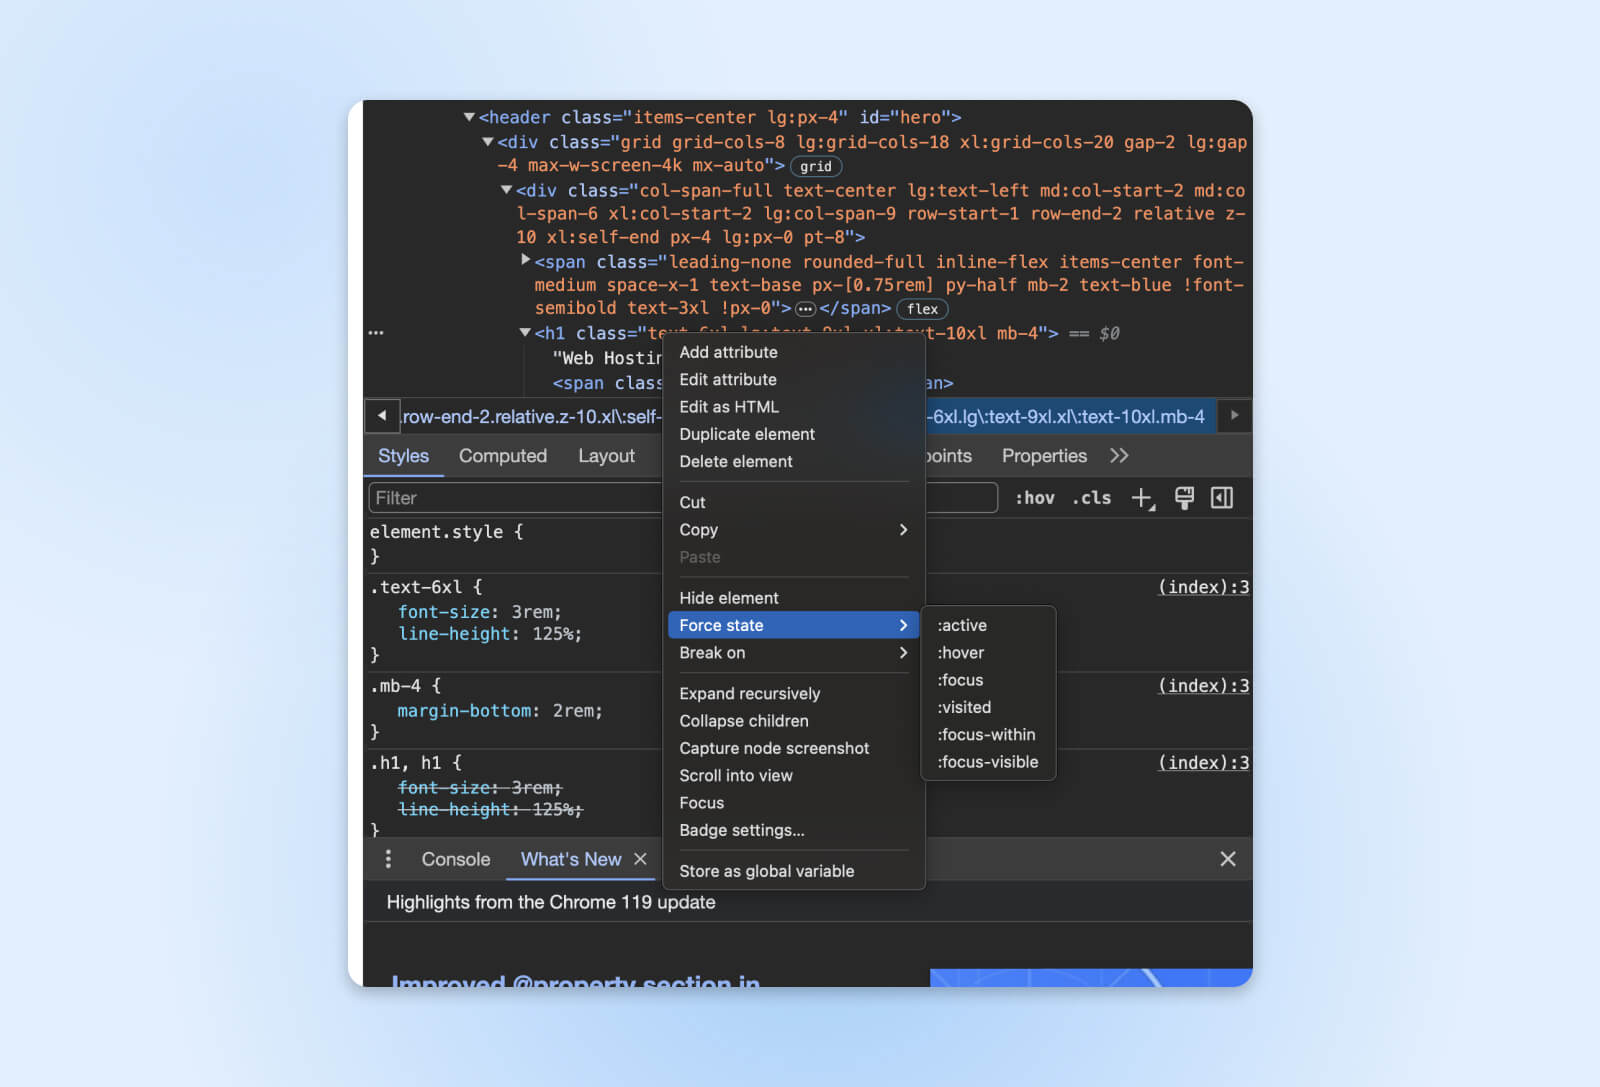
For example, toggle a button’s active state to ensure the pushed effect is visible to users. Check disabled field borders to see if they offer proper contrast. Validate menu links highlight appropriately on focus during keyboard navigation testing.
Hide Or Delete Items
Finally, bulk hiding or deletion of page elements is possible, too. It can help identify unnecessary code bloating page size, block elements from rendering correctly, or unexpectedly hide desired content from users.
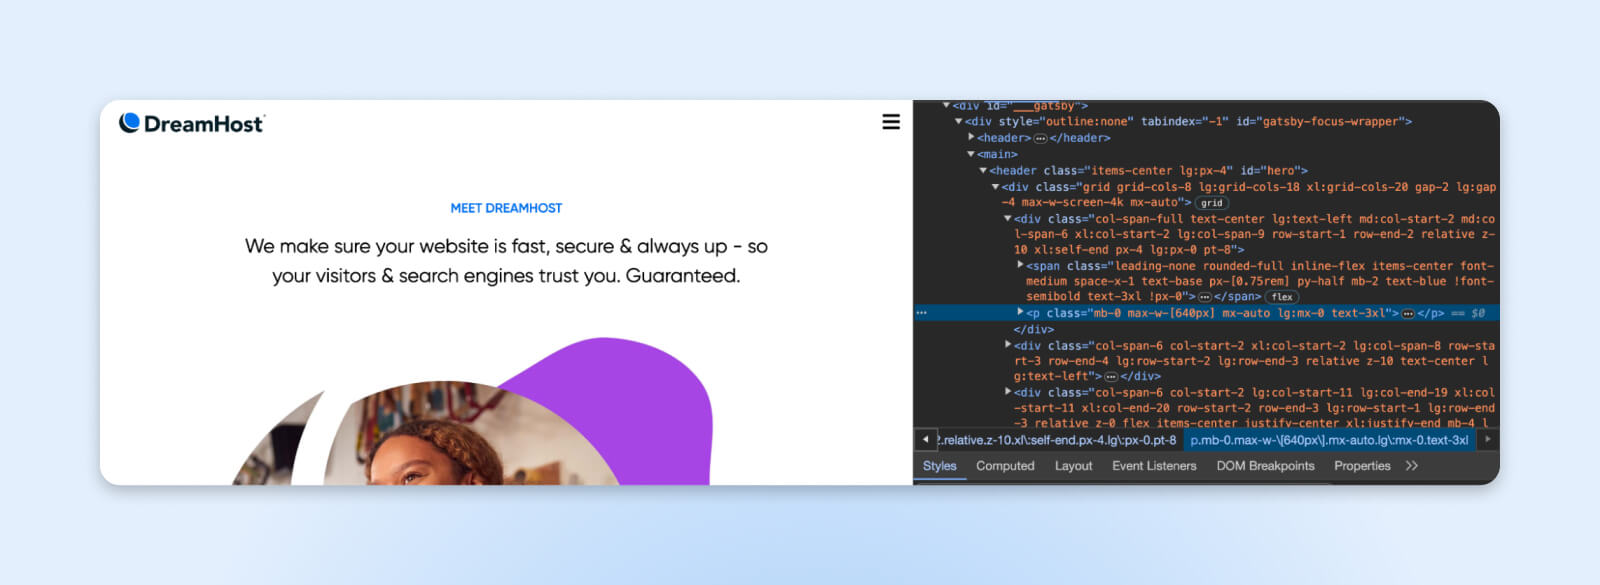
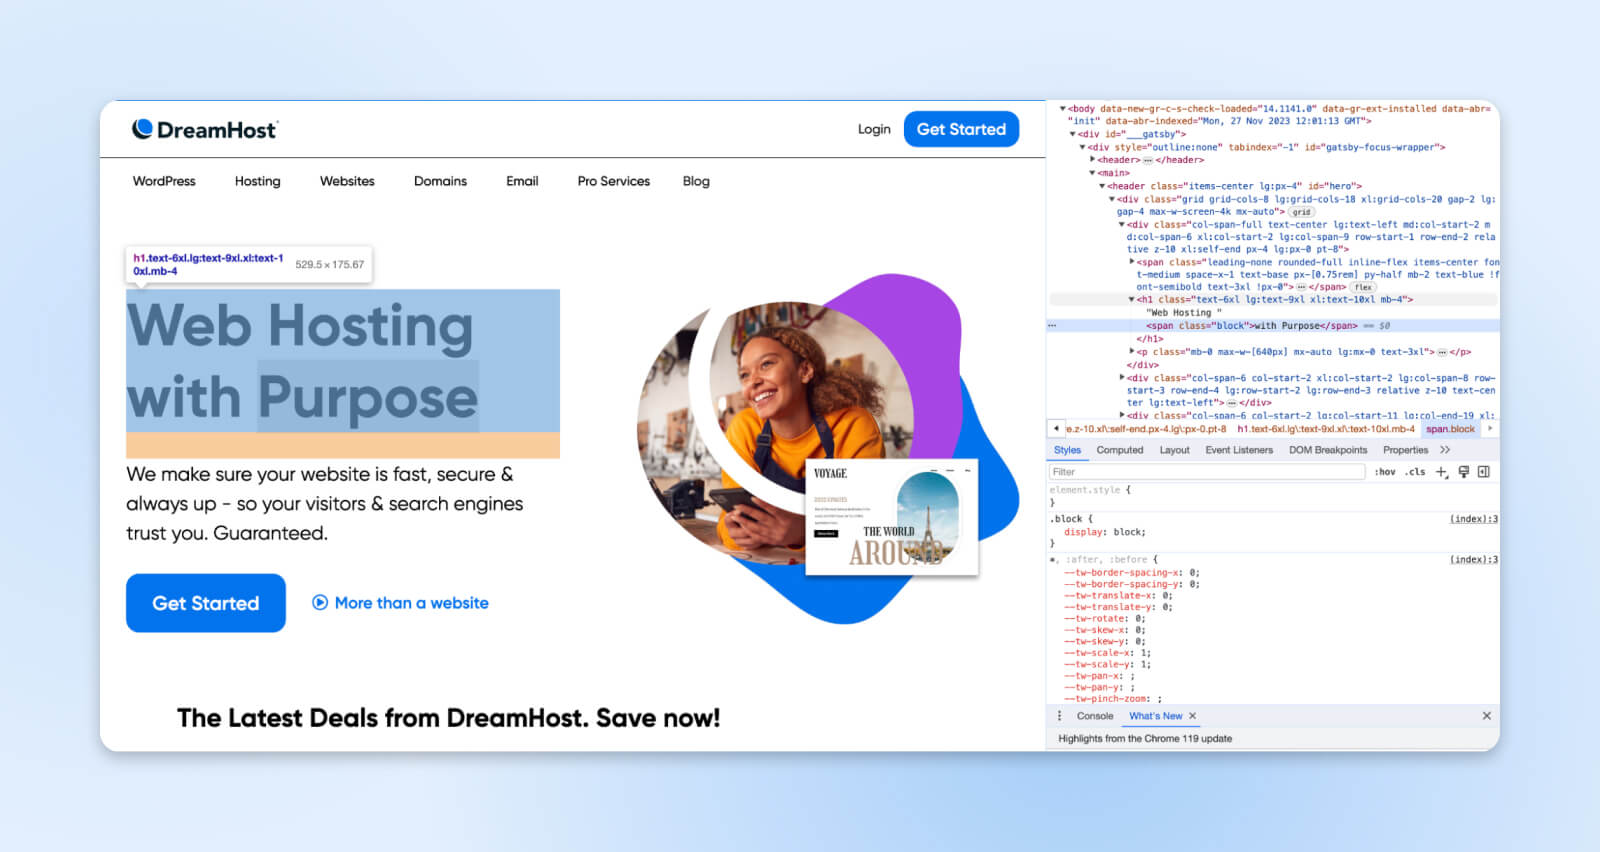
To try this, simply highlight any element in the code and press delete to remove it from the rendered view instantly.
In the screenshot, we have deleted the DreamHost’s homepage heading from our view. You can do much more with Inspect Element as you explore it.
FAQs
Can you use Inspect Element on any website?
Yes, Inspect Element works universally across all modern websites. However, some websites render code on the server side and only push JavaScript objects to the front end. This is generally done to prevent web scrapers from pulling data, and it can become difficult for you to understand the site structure using Inspect Element.
Do changes made in Inspect Element save permanently?
No. Any edits made via inspector tools only temporarily render locally within your browser view. Refreshing reverts to the default external page content. Changes will not impact actual source files whatsoever.
Can other users see tweaks when inspecting websites?
Inspect Element edits cannot be viewed by other users browsing websites, even while signing into the same browser profile across multiple devices. Think of changes as exclusive to your machine only.
Are there other developer tools beyond Inspect Element?
Absolutely. As mentioned earlier, Console, Sources, Network, and other analysis tabs also prove invaluable during development. Plus, browser extensions extend DevTools capabilities even further.
Don’t Just View Websites, Interact With The Code
Playing around with the Inspect Element feature peels back the curtain on how websites work. Letting you peek at the HTML, CSS, and JavaScript underneath any page you click can easily help you understand why something looks and feels the way it does.
So, as you surf around, keep that Inspect Element tool handy. Let curiosity guide you as you click around to see what makes things appear as they do. Who knows, you might just pick up new methods to help the web become an even more accessible and fun place!


