Graphic Design Statistics (How Many Graphic Designers Are There?)

Want to learn more about the state of graphic design this year? We’ve got you covered.
In this post, we’ll look at all the most important graphic design statistics that tell us more about this creative industry, the people who work in it, the software they use, and the companies that hire them.
Plus, we’ll be revealing the latest graphic design trends, and a whole lot more. Ready? Let’s get started!
Graphic Design Statistics (Top Picks)
- The global graphic design market size is $43.4 billion.
- There are 507,690 graphic designers employed globally, and 265,000 in the US.
- 90% of graphic designers work freelance.
- 54% of graphic designers leave/change jobs in under 2 years, on average.
- Fortune 500 companies account for over 17% of graphic design employment.
- Demand for graphic design professionals is predicted to grow by 3% by 2031.
- 50.2% of graphic designers are female and 49.8% are male.
- 68% of graphic designers have a Bachelor’s degree.
- The average graphic designer in the US earns around $50.7k per year and around $24 per hour.
- Graphic designers specializing in UX design earn the most, with an average annual salary of over $110k.
- This year’s top graphic design trends include fluorescent color palettes, 90s nostalgia, and embossed packaging.
- 80% of small businesses say the design of their branding/marketing materials is important, and 50.5% of marketers say visual content is very important.
- 35.5% of marketers use online tools and graphic makers to create visual content, while 17.8% will hire a freelance designer, and 28% hire an in-house designer.
- Photoshop is the most popular graphic design software with a market share of 43.8%.
How many graphic designers are there?
According to the best data we could find, at least half a million graphic designers are employed globally. Of those, more than half (265k) are employed in the US and the vast majority work freelance.
How many graphic design jobs are there?
According to IBISWorld’s industry analysis, the global graphic design industry employs 507,690 people. This means there are over half a million graphic design jobs out there.
The US Bureau of Labor Statistics reports 265,000 graphic design jobs in the US alone in 2021. There are also projected to be around 24,800 graphic design job openings annually in the US. Freelance graphic designers account for 90% of industry jobs.
Who employs graphic designers?
The largest graphic designer employers in the US are:
- Self-employed workers – 19%
- Specialized design services – 9%
- Advertising, PR, & related services – 9%
- Printing & related support activities – 7%
- Newspaper, book, periodical, & directory publishers – 5%
What sectors do graphic designers work in?
According to Zippia, half of all graphic designers in the US work in the private sector:
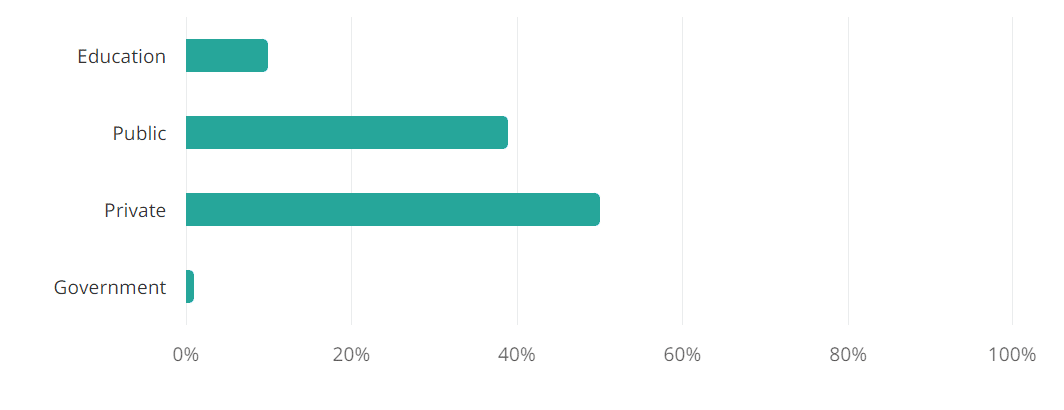
- 50% of graphic designers are employed in the private sector
- 39% of graphic designers are employed in the public sector
- 10% of graphic designers are employed in the education sector
- 1% of graphic designers are employed in the government sector.
How often do graphic designers leave their jobs?
Turnover amongst graphic designers in the US is faster than in many other occupations. Over half of graphic designers leave their jobs in the first 2 years.
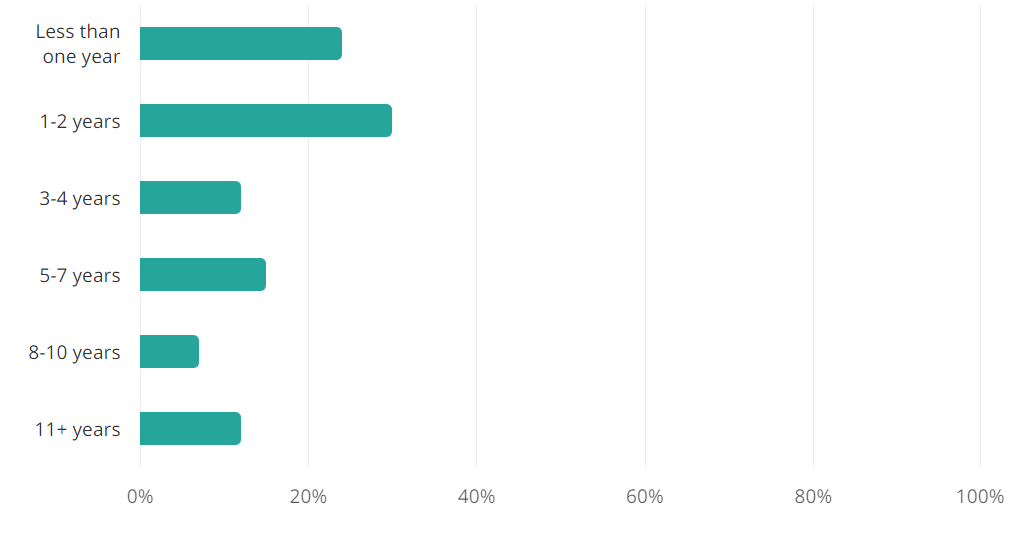
- 24% of graphic designers change jobs in the first year
- 30% of graphic designers change jobs within 1-2 years
- 12% of graphic designers change jobs within 3-4 years
- 15% of graphic designers change jobs within 5-7 years
- 7% of graphic designers change jobs within 8-10 years
- 12% of graphic designers change jobs within 11+ years
Top 10 industries that hire graphic designers
Around 17% of graphic designers in the US are employed by Fortune 500 companies, making this the top industry that hires graphic designers.
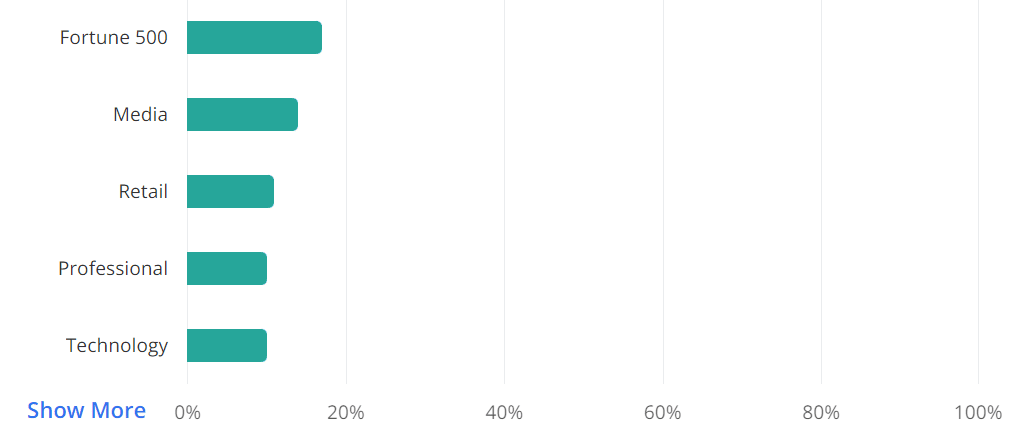
Media is the second biggest industry that hires graphic designers, accounting for 14% of all jobs in the space.
Will graphic designers become obsolete?
Despite advancements in AI technology, it’s unlikely that graphic designers will ever become obsolete.
Around 24.8k new graphic design jobs are predicted to become available every year in the US, which suggests skilled designers will still be in demand in the near future. However, this demand isn’t growing as quickly as some other sectors.
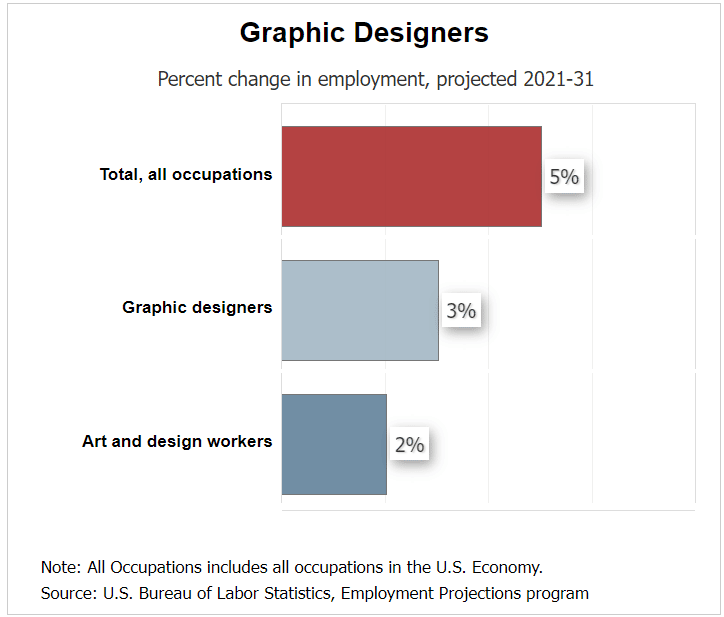
Demand for graphic designers is only predicted to grow by 3% over the next decade (2021-2031). This is two percentage points lower than the average across occupations, which stands at 5%.
What’s the work/life balance of a graphic designer?
Graphic designers’ work/life balance is rated 3.7/5 on Glassdoor, which is reasonably good. For comparison, the average work-life balance rating across all companies was 3.2 in 2015.
Sources: IBISWorld2, Bureau of Labor Statistics, Zippia, Glassdoor2
Graphic designer demographics
Most graphic designers in the US are over 30 years old. Over three-quarters are white, and over two-thirds are holders of Bachelor’s degree. There are slightly more female graphic designers than male, though the gender split is fairly even.
Graphic designers by gender
Interestingly, graphic design seems to be one of the most balanced industries when it comes to gender, with an almost 50/50 male-to-female ratio.
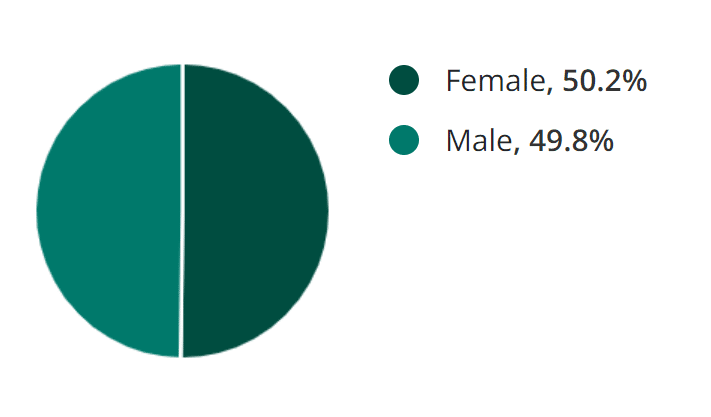
- 50.2% of graphic designers are female
- 49.8% of graphic designers are male
While this shows that there are slightly more female graphic designers than males, the difference is just 0.4%. This starkly contrasts to many other professions, where the gender split is much more pronounced.
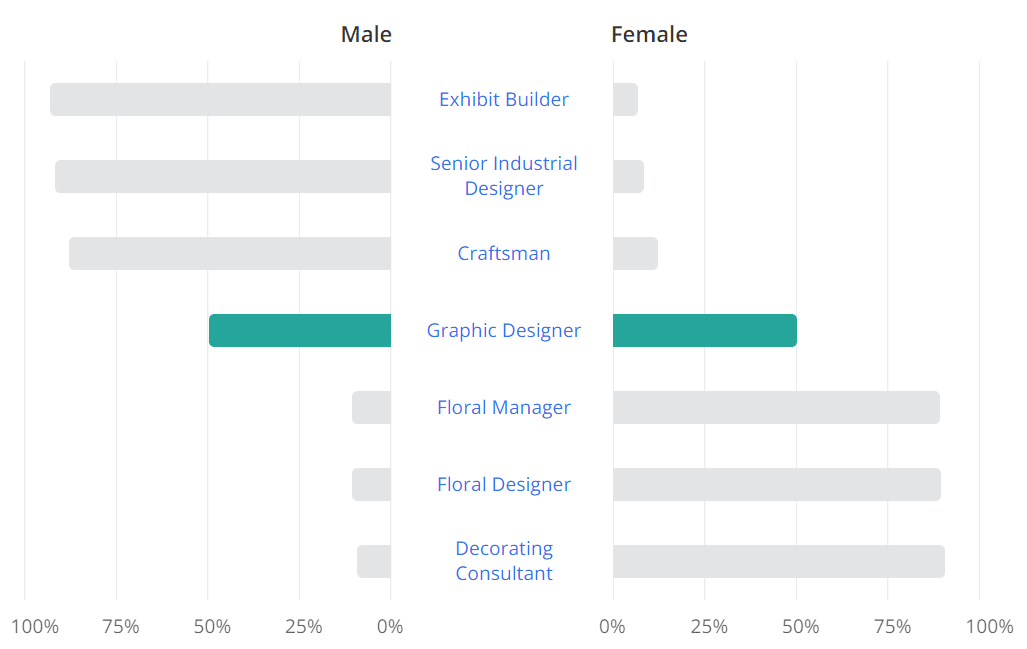
For example, exhibit builders in the US overwhelmingly tend to be male (93%), while the vast majority of decorating consultants are female (91%).
Graphic designer ages
Most graphic designers in the US are over 30. According to the graphic design statistics:
- 39% are over 40 years old
- 34% are 30-40 years old
- 27% are 20-30 years old
Graphic designer education levels
Most graphic designers are educated at the University level, with over two-thirds holding a Bachelor’s degree:
- 68% of graphic designers hold a Bachelor’s degree
- 23% of graphic designers hold an Associate degree
- 3% of graphic designers hold a Master’s degree
- 3% of graphic designers hold a High School Diploma
- 3% of graphic designers hold other degrees
Graphic designer ethnicities
Around three-quarters of graphic designers in the US are White, making this the ethnic majority in the profession.

While this might be somewhat expected given that White Americans are also the country’s largest ethnic group, it’s still proportionally greater compared to the population as a whole. Only 57.8% of the entire US population is White, compared to 76.1% of graphic designers.
- White – 76.1%
- Hispanic or Latino – 10.2%
- Asian – 7.6%
- Black or African American – 3.5%
- Unknown – 2.3%
- American Indian and Alaska Native – 0.3%
Most common foreign languages spoken by graphic designers
English is the primary language spoken by most graphic designers in the US. Amongst those that speak foreign languages:
- 49.7% speak Spanish
- 9.6% speak French
- 5.8% speak Chinese
- 4.8% speak Mandarin
- 4.3% speak Japanese
- 25.8% speak Other
Sources: Zippia
How much do graphic designers earn?
Graphic designer earnings vary wildly depending on the country. The average graphic designer earns around $50k per year in the US. But in India, the average designer only earns around $3.5k per year (₹24,500/month).
The amount graphic designers earn also varies depending on specialization, role, and years of experience.
What’s the average graphic designer salary?
The median graphic designer wage in the US was $50,710 in May 2021. This is greater than the average across all occupations, which was $45,760.
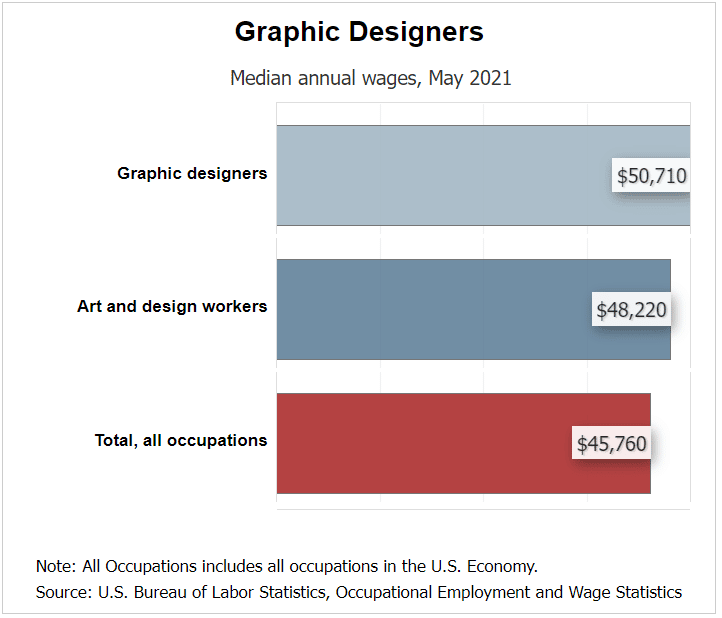
However, there’s a big difference between the top and bottom end of the pay scale. The top 10% of graphic designers earned over $98,260 in 2021, while the bottom 10% earned less than $31,310.
How much do graphic designers charge per hour?
The average hourly graphic designer wage in the US is $24.38 per hour, according to the latest graphic design statistics.
Do male graphic designers earn more?
Even though more graphic designers are female, male graphic designers tend to earn more on average.
- The average male graphic designer earns $52,649 per year
- The average female graphic designer earns $49,963 per year
- Women earn $0.95 for every $1 men earn.
Average graphic design salary by country
Graphic designers in developed countries with higher average incomes tend to earn significantly more than those in developing countries. For example, graphic designers in the US earn over 10x as much per month as those in India, according to data from Glassdoor:
- US – $52,866/year
- UK – £29,611/year
- Canada – CA$51,162/year
- Australia – A$65,000/year
- South Africa – ZAR 15,343/month
- India – ₹24,500/month
- China – CN¥11,142/month
Average graphic design salary by role
- Senior graphic designer – $71,417/year
- Entry level graphic designer – $40,148/year
- Freelance graphic designer – $64,409/year
Highest-paying graphic design specializations
There are many different specializations within graphic design. Graphic designers that specialize in product design and UX design earn the most, with average salaries exceeding $100k.
Graphic design salaries in the US by specialization:
- Product designer – $108,906/year
- Web design – $61,077/year
- UI designer – $98,795/year
- UX design – $110,392/year
- Motion graphics designer – $68,392/year
- Packaging design – $62,896/year
- Game design – $75,080/year
- Marketing design – $61,397/year
- Logo design – $63,698/year
- Illustrator – $58,257/year
Sources: Bureau of Labor Statistics, Zippia, Glassdoor2
How big is the graphic design market?
Next, let’s look at some graphic design statistics that tell us more about the size of the graphic design market and how it’s changed over time.
Global graphic design market size
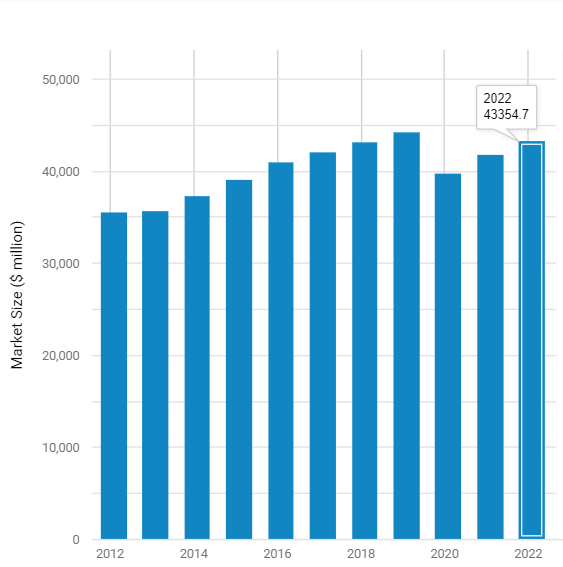
According to data from IBISWorld, the global graphic design industry market size is $43.4 billion as of 2025. It’s also the 9th-ranked global business activity industry by market size.
Growth of the global graphic design market
The global graphic design industry grew by 3.7% from 2022 to 2023. However, if we look at the average growth rate over a longer period, it’s less impressive. The graphic design market only grew by 0.6% per year on average since 2017, underperforming the global economy.
This unimpressive growth rate is largely due to the fall in market size from 2019 to 2020 when the value fell from $44.27 billion to $39.76 billion, which was no doubt due to the economic effects of the global pandemic outbreak.
Since then, the market has recovered somewhat, though it’s still not as large as at its peak in 2019 (44.27 billion)
Global graphic design market growth over time:
- 2012: 35.65b
- 2013: 35.73b
- 2014: 37.43b
- 2015: 39.18b
- 2016: 41.09b
- 2017: 42.07b
- 2018: 43.25b
- 2019: 44.27b
- 2020: 39.76b
- 2021: 41.81b
- 2022: 43.36b
US graphic design market size
The US graphic design market reached $14.1 billion in 2024.
Growth of the US graphic design market
The graphic design market in the US grew by 2.3% in 2022. This is slightly below the average yearly growth over the last 5 years: 2.6%.
Interestingly, the US graphic design market didn’t seem to be as badly affected by the pandemic as the global graphic design market as there was no decline from 2019 to 2020.
US graphic design market growth over time:
- 2012: 12.5b
- 2013: 12.55b
- 2014: 12.57b
- 2015: 12.45b
- 2016: 12.06b
- 2017: 12.41b
- 2018: 12.82b
- 2019: 13.02b
- 2020: 13.05b
- 2021: 13.80b
- 2022: 14.12b
Sources: IBISWorld1, IBISWorld2
Graphic design trends
There’s no quantitative data we can look to in order to find out the biggest design trends of the year. And you’ll get a different opinion about what’s trending depending on who you ask.
With that in mind, here are the top graphic design trends for 2023 as identified by various publications:
Top 5 graphic design trends according to Later:
1. Fluorescent Color Palettes
2. 60s & 80s iconography
3. Contrasting fonts
4. Maximalism
5. Cloud motifs
Top 5 graphic design trends according to Nascent Design:
1. 90s nostalgia
2. Typography with personality
3. Psychedelic vision
4. 2D & 3D mashup
5. Anti-design
Top 5 graphic design trends according to InDesign:
1. Embossed Packaging
2. Pictotype Logos
3. Refined Retro
4. Noisy Gradients
5. Brand Mascots
Sources: Later, Nascent, InDesign
Graphic design in marketing
Graphic design is often used in marketing to promote brands and products in a visually-appealing way. Here are some interesting graphic design statistics relating to marketing, as revealed in recent surveys and reports.
- 50.5% of marketers say visual content is very important to their marketing strategy
- And a further 13.1% say their strategy is nothing without visual content.
- 80% of small businesses rate the design of their branding and marketing materials as either “important” or “very important”
- Only 3% said design is “not important”
- 73% of companies invest in graphic design for brand differentiation
- 57.9% of marketers pivoted their content marketing strategy last year. Of those, almost half either branded or created a new visual identity.
- 51.4% of marketers said that between 91 and 200% of their content contained visuals.
- The most common type of visual content used by marketers in 2021 was original graphics (like infographics and illustrations). 36.4% of marketers said they used original graphics.
- Original graphics was also the best-performing visual content type in 2021, according to 41.1% of marketers.
How long do marketers spend on graphic design?
According to a recent survey, almost half of all marketers spend less than 5 hours producing visual content (i.e. graphic design):
- 23.4% spend less than hours
- 24.3% spend 2-5 hours
- 19.6% spend 5-10 hours
- 14.9% spend 10-15 hours
- 17.8% spend 20+ hours
What do marketers use to create visual content?
When asked how they create visual content:
- 35.5% of surveyed marketers said they use an online tool or graphic maker
- 28% of marketers said they have an in-house designer create it
- 18.7% of marketers said they use advanced design software (e.g. Adobe Illustrator)
- 17.8% of marketers said they use a freelance designer
Top graphic design challenges in marketing
- 31.8% of surveyed marketers say the biggest challenge in producing engaging visual content is consistency
- 26.2% say sourcing data and statistics or writing the copy is the hardest part
- 22.4% say finding the right layout is the biggest challenge
- And 19.6% say creating a great design is the hardest part
How much should marketers spend on graphic design?
- 26.2% of surveyed marketers project spending 21-30% of their budget on creating visual content
- 28% of surveyed marketers say they spend most on the ‘design’ part of creating visual content
Where do businesses use visual content?
- 30% of surveyed businesses use visual content in blog posts
- 18.6% of surveyed businesses use visual content on Facebook
- 15.9% of surveyed businesses use visual content on Linkedin
- 13.1% of surveyed businesses use visual content on Instagram
- 13.1% of surveyed businesses use visual content on landing pages
- 9.3% of surveyed businesses use visual content in print/branding materials
Sources: Venngage, 99designs, Adobe Digital Design
Color in graphic design
Color is one of the most important parts of graphic design.
Studies show that people make their minds up about people and products within 90 seconds, and 62-90% of this initial assessment is based solely on color. Not only that, but using a signature color can boost brand awareness by as much as 80%.
Black seems to be the most popular color used in logo design, with over 34% of the top 100 global brands using it. Blue is another popular choice, while brown is the least popular choice.
Top colors used in logo design by the top 100 global brands:
- 34% use black
- 30% use blue
- 30% use red
- 9% used yellow
- 7% used green
- 6% used grey/silver
- 5% used orange
- 2% used brown
Sources: Reboot Online, Research Gate
Graphic design software statistics
Adobe dominates the graphic design software market. The majority of graphic design professionals uses their Creative Cloud products. Other popular graphic design tools include SketchUp and cloud-based platforms like Canva.
What’s the most popular graphic design software?
According to Datanyze, Photoshop is the leading graphics software, with over 43.81% of the market share:
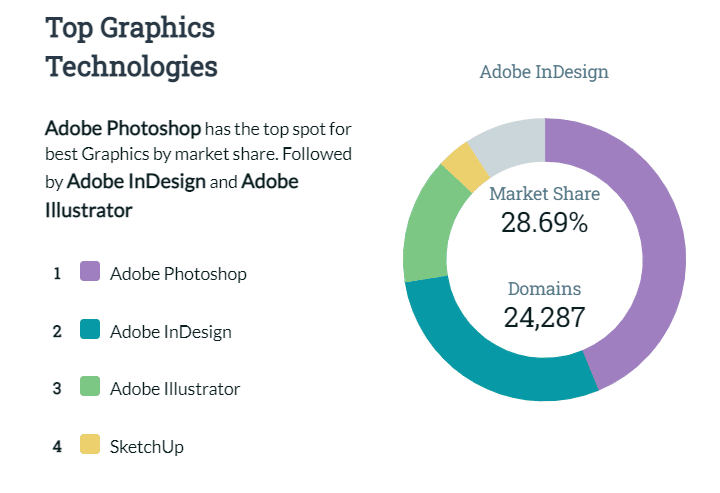
Top graphic design software solutions by market share:
- Photoshop – 43.8%
- Illustrator – 14.5%
- InDesign – 28.7%
- SketchUp – 3.9%
- CorelDRAW – 2%
- Canva – 1.8%
Bear in mind that it’s not clear how accurate these market share estimations are, as they seem to be based on the number of companies that use them as identified by Datanyze, rather than total users. So take them with a pinch of salt.
Adobe statistics
Adobe powers most of the most popular software graphic design professionals use (Photoshop, Illustrator, InDesign, After Effects, etc.). Here are some statistics about this software provider.
- Adobe earned 15.79 billion in revenue in 2021
- Over 90% of the world’s creative professionals use Adobe products
- Adobe Stock offers over 300+ million creative assets, including vectors, illustrations, photos, etc.
- Adobe’s online creative community Behance has over 30 million members
Canva statistics
Canva is one of the most popular cloud-based graphic design tools, growing rapidly in the last few years. Here are some Canva statistics that tell us more:
- Canva was valued at $40 billion in the last trimester of 2021. This is up from $19 billion in April 2021. Since then, Canva has doubled its revenues.
- Canva’s revenues were predicted to exceed $1 billion by the end of 2021.
- Canva has over 75 million monthly active users spanning 190 countries
- 3.5 billion designs were created with Canva in 2021
- 150 designs are created on Canva every second
- 23 designs are created on Canva’s iPhone and iPad apps every second
- 8 billion designs have been created on Canva in total.
- There are over 100 million stock images, graphic elements, and videos in Canva’s library
Sources: Smart Company, Canva, Adobe, Datanyze
Graphic design costs
Next, let’s look at some graphic design statistics that tell us about the costs involved in hiring a graphic designer, and how much businesses are willing to pay for design services.
How much should companies pay for graphic design services?
According to a survey of small businesses, most aren’t willing to spend over $500 on their logos:
- 65% of small companies will pay up to $500 for a logo
- 20% of small companies will pay up to $1000 for a logo
- 15% of small companies will spend over $1,000 for a logo
But interestingly, the data also shows that companies who spend more to become design-driven are 69% more likely to exceed their goals.
How often do businesses outsource graphic design?
- 50% of surveyed small businesses handle graphic design work in-house
- 21% of surveyed small businesses outsource graphic design work to freelancers
- 18% of surveyed small businesses run crowdsourced design contests
- 7% of surveyed small businesses outsource graphic design work to design agencies
Source: 99designs, Adobe Digital Design
Interesting facts about graphic design
- In a survey of small businesses, Apple was most frequently named as the company with the best logo.
- Other high-ranking company logos included Nike, Coca-Cola, Google, and FedEx
- The Walmart logo was most frequently picked as the worst logo by small businesses.
- Other low-ranking logos included Pepsi, Microsoft, and IBM.
- The brain processes images 60,000 times faster than text. This is because the human brain deciphers the different elements of an image simultaneously, while language is decoded in a linear, sequential manner, which takes significantly longer to process.
Sources: MIS, 99designs
Final thoughts
That concludes our roundup of graphic design statistics. Hopefully, these stats have given you some food for thought.
As these stats show, graphic designers are still very much in demand. And while the industry is constantly evolving—with new trends, new software, and new technology changing the way designers do their jobs—it’s likely that there will still be plenty of work in graphic design for years to come.
Still hungry for knowledge? Check out our roundup of social media statistics to find out how the social landscape is changing.
Was this article helpful?
YesNo


