Using a Columnar Database to Increase Speed

How our engineering team keep ChartMogul accurate, fast and scalable by enhancing our data model.
ChartMogul is growing, and with growth comes new requirements. Last year we realized that the architecture that is used to calculate and service real-time SaaS metrics needed to be re-evaluated. Subscription analytics is the backbone of our product and we need it to be not just accurate, but also fast and scalable.
Although our current data model has been well-fit for all of our needs until now, with more and more large customers, it was time to explore a more enhanced set up.
We wanted to:
- Greatly improve the performance of reports for large customers
- Improve the performance of reports for medium and small customers
- Preserve fast data updates
- Performantly execute computational-heavy analyses
All of our data (billing, subscriptions, customers, etc.) is written to a relational and row-oriented database with fast transactions, great for performing thousands of single data updates each minute in a safe, performant manner.
However, almost all of our SaaS metrics computations are done in real time by the same database. This wasn’t a problem in the past, but with the amount of data increasing and our desire to provide more complex business metrics, calculations are bound to be slower to execute in a row-oriented database.
The solution: use a columnar database to compute our metrics.
Row vs. column oriented databases
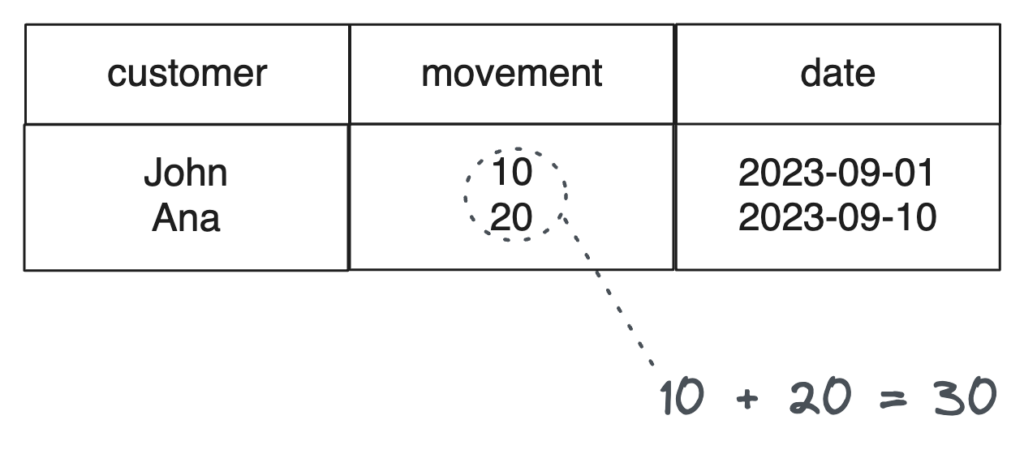
Imagine the following data in a table in our database:

In a row-oriented database, these would be stored as:

This makes it fast to store new rows, by just appending them to the existing data, or to find and/or update a specific customer and their data. However, for data aggregations, this is not ideal. If we want to calculate the sum of the movement column, for example, we will have to pull all of the table’s data into memory and only after that we will perform the sum:

This process consumes more memory and also accesses more disk storage, slowing down the aggregation.
In a column-oriented database, however, the data is grouped by each individual column:

This makes data aggregations faster, as all of each column’s data is already banded together and we can pull just the values that we want. So, when doing the same aggregation as before, we will only pluck the numbers from the movement column:

This is faster, not only because we hold less data in memory, but also because the data of each column is stored on the same block, making it faster to access.
A new database
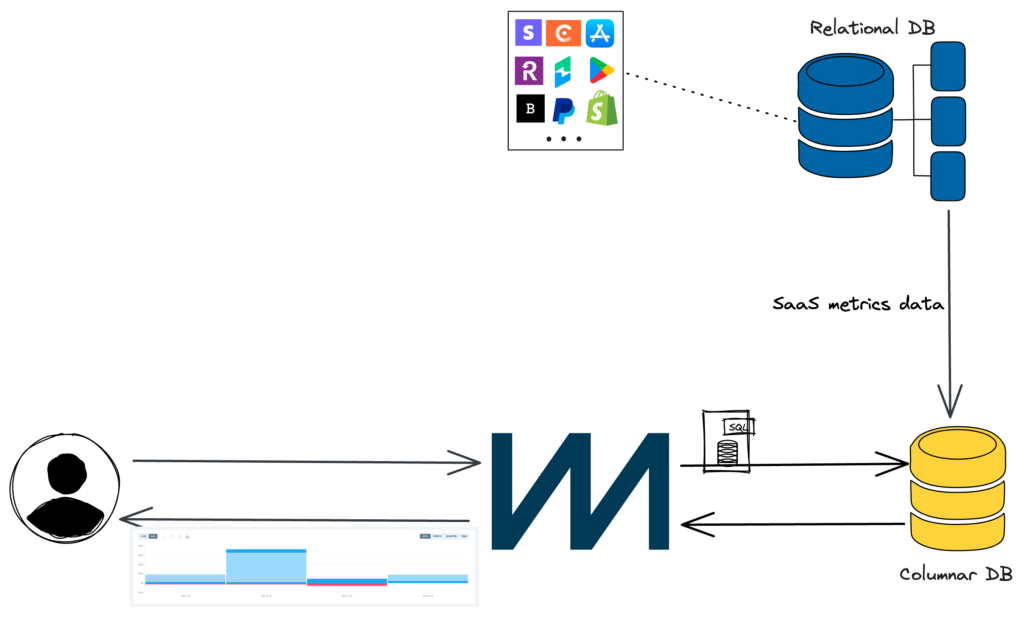
We are using the same database for both transactions and almost all reporting. In our new model however, we copy some of our data from our current database to a columnar one. We do not need to copy all of the data, just what is needed for ChartMogul’s reports.
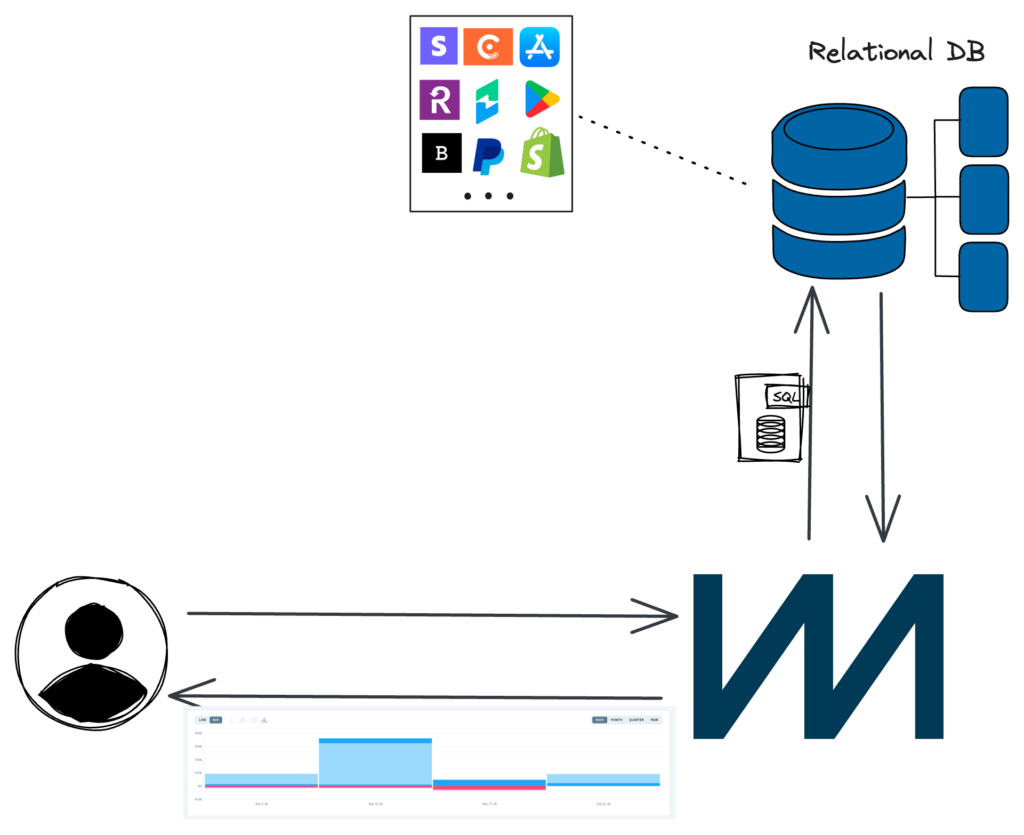
Put simply, we move from an architecture like this:

…to something like this:

All of the data is still stored in the relational database. The columnar database will be the means for us to perform the SQL queries of our metrics in a more performant manner.
Performance so far
If you use ChartMogul, you’re probably already familiar with the first feature using this new iteration: Net MRR Movements.
The complex computation of the Net MRR Movements report cannot be handled by the relational database, so we are servicing the report using a new columnar database that we added to our system. Although this experience was a success, that database is not the same as the one we’re currently migrating our reports to. Remember those improved model goals highlighted in the introduction? Well, we wanted a solution that would check every item on that list.
So we decided to migrate all of our reports to ClickHouse, a fast column-oriented database that has proved to fit all of our needs for analytics. We are already using it for some of the reports, and we’re working on migrating every one of them.
Performance has been excellent so far. Even some outlier situations, when reports would time out due to their complexity together with a large amount of data, are now handled with ease.
Future plans and closing thoughts
The immediate goal is to continue the migration until all reports are using the new database.
After that, and already in motion, we want to start ingesting reporting-related data directly into the new database, allowing us to cut out the middleman. Moreover, this will allow us to store data in the format that ClickHouse needs to be the most performant possible, improving speed even more.
We are very excited about using this new tool, not only because it improves the foundation of ChartMogul, but also because it opens new doors to more complex but still agile metrics and aggregations.
Stay tuned for more insights as our database journey unfolds, and if you liked this post, check out the story of how we built a data engineering stack that boosts scalability.


