What is the Average Deal Size for Private SaaS Companies in 2023?

Due to their compliance reporting requirements, there is plenty of data available about public SaaS companies. However, due to the size and funding of those companies, their metrics are typically not a good benchmarking metric for smaller, private SaaS companies. In order to provide peer-based benchmarking, SaaS Capital conducts a survey of private, B2B SaaS company metrics in the first quarter of each year. Our 12th annual survey, completed in March 2023, saw more than 1,500 SaaS companies respond. This post summarizes benchmarking data around the topic of Annual Contract Value (ACV).
What is the average ACV for Private SaaS Companies?
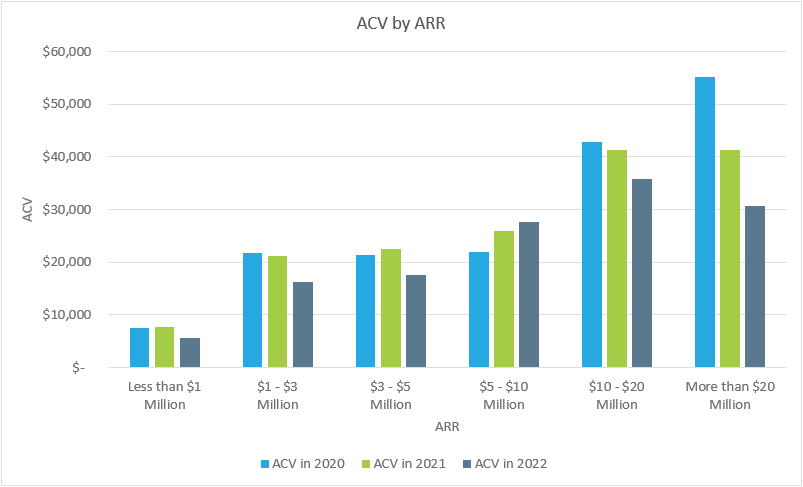
Across all companies in the survey, the median ACV is $17,791. However, for benchmarking purposes, it is useful to look at companies by size as well as trends over time. The graph below shows ACV by Annual Recurring Revenue (ARR) for the last three years.

There are two takeaways from the graph. The first is that deal size is correlated with company size. For example, companies with ARR $1 – $3 Million in ARR show a median ACV of $16,197 while companies with ARR of $10 – $20 Million show a median ACV of $35,831.
As companies grow, they deepen their product, add new modules, expand into new verticals and / or geographies, and tend to sell to larger and larger customers. This expands average ticket price. Larger companies also just have more time in market (read: confidence) to charge more. We are not surprised larger companies have a higher ACV than their earlier-stage peers.
The second takeaway is that for all but one company size (those with ARR $5 – $10 Million) ACVs generally declined vs. 2021. This is worth noting as research by Randall Lucas in Changing ACVs: The Hidden Control Lever of SaaS Company Value showed that companies that with higher ACV growth tend to grow faster, and those with flat to shrinking ACVs grow the least.
- Software and technology had a boon of a year in 2021 as their customers accelerated digital transformations in the new work-from-home world. The SaaS Capital Index of public company valuation multiples peaked at 16.9 in August 2021. Inflation in Q1 2021 was still only 1.6%!
- By the end of 2021 inflation had begun to climb and the exuberance ended quickly. There was a very real fear of a recession and companies drove towards profitability at the expense of growth. They focused on retaining existing customers – apparently by lowering prices in 2022.
Average Deal Size by Retention Rates
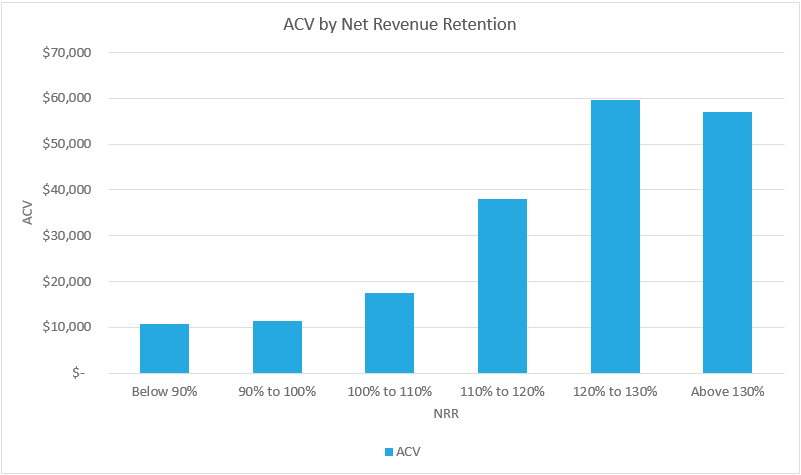
Previous research on retention, What is a Good Retention Rate for a Private SaaS Company in 2023?, showed that higher net retention correlates with higher ACVs. The chart below illustrates that from the opposite perspective.

Here we see median ACVs broken down by Net Revenue Retention (NRR) levels. The relationship between higher retention rates and higher ACVs makes intuitive sense as net retention includes expansion revenue (such as from price increases and up-sells), minus any churn from cancellations and downgrades. In other words, companies that are better at upselling and increasing prices see ACVs rise.
This chart puts even a finer point on this relationship. This view on the data shows two clear and interesting points:
Average Deal Size by Funding
Bootstrapped and equity-backed companies often optimize toward different goals. Our survey data has shown that bootstrapped companies necessarily spend less, optimizing for profitability while equity-backed spend more (https://www.saas-capital.com/research/private-saas-company-growth-rate-benchmarks/) to optimize for growth. The table below shows the median ACV and ARR by funding type for private SaaS companies with more than $1 million in ARR.

The obvious takeaway is that private bootstrapped and equity-backed also have different ACV and ARR profiles. As noted above, deal size is correlated with company size. Equity-backed companies with at least $1 million in ARR show a median ARR that is twice that of bootstrapped companies and the ACV/ARR correlation holds true.
Also, as mentioned, VC-backed companies can spend faster, building additional products and features faster than their bootstrapped counterparts, allowing them to charge more.
Final Thoughts on ACVs
The data above shows that there is no one-size-fits-all benchmark for SaaS deal sizes. However, this data is helpful for benchmarking your company against your peers, and for determining strategic direction and value as you plan where you want to take your product in the future.
![]()


