How To Supercharge Site Speed With GTmetrix

We all know how frustrating it can be to get stuck on a slow-loading site.
Whether you’re looking for product information, making an online appointment, or trying to chat with customer service, the last thing you need is to stare at a blank screen when you have things to do.
Plus, in a fast-paced world with so many competitive options, people just aren’t willing to wait. Unbounce asked mobile users how long they would wait for a web page to load. 32.3% of people said they’d give it four to six seconds, but 26.9% were ready to bail in the first three seconds.
The bottom line?
Site load speed matters.
So how can you ensure that your website is optimized for speed?
That’s where GTmetrix comes in.
What Is GTmetrix?
GTmetrix is a popular online website speed test tool. It analyzes a website’s performance and provides actionable insights you can use to optimize the site’s performance. It gives detailed information about how your site loads, which you can turn into recommendations for improvements.
Website Performance
A website’s performance refers to the speed and uptime of the site. A better-performing site will have faster load times, run more smoothly, and have little to no downtime.
Read More
When you analyze your site with GTmetrix, it provides you with a set of scores based on Google’s Lighthouse (formerly Pagespeed Insights) and Web Vitals metrics that can help you more deeply understand where your site stands in terms of performance.
Don’t worry.
We’ll do a deep dive into each of these scores (and everything else GTmetrix tells you) further down. By using GTmetrix, you can pinpoint bottlenecks in your site’s loading process and prioritize fixes that will lead to faster load times and a better overall user experience.
Why Use GTmetrix?
GTmetrix is a popular (and free!) tool that can help you understand and improve your website’s speed and performance. That’s important for a number of reasons:
With all these benefits in mind, let’s move on to the tutorial — read on to learn how to analyze your site with GTmetrix.
Get Content Delivered Straight to Your Inbox
Subscribe to our blog and receive great content just like this delivered straight to your inbox.
How Do You Use GTmetrix?
Using GTmetrix to analyze your site’s performance is actually very straightforward. Here’s a step-by-step guide to help you get started.
Step 1: Go To The GTmetrix Website
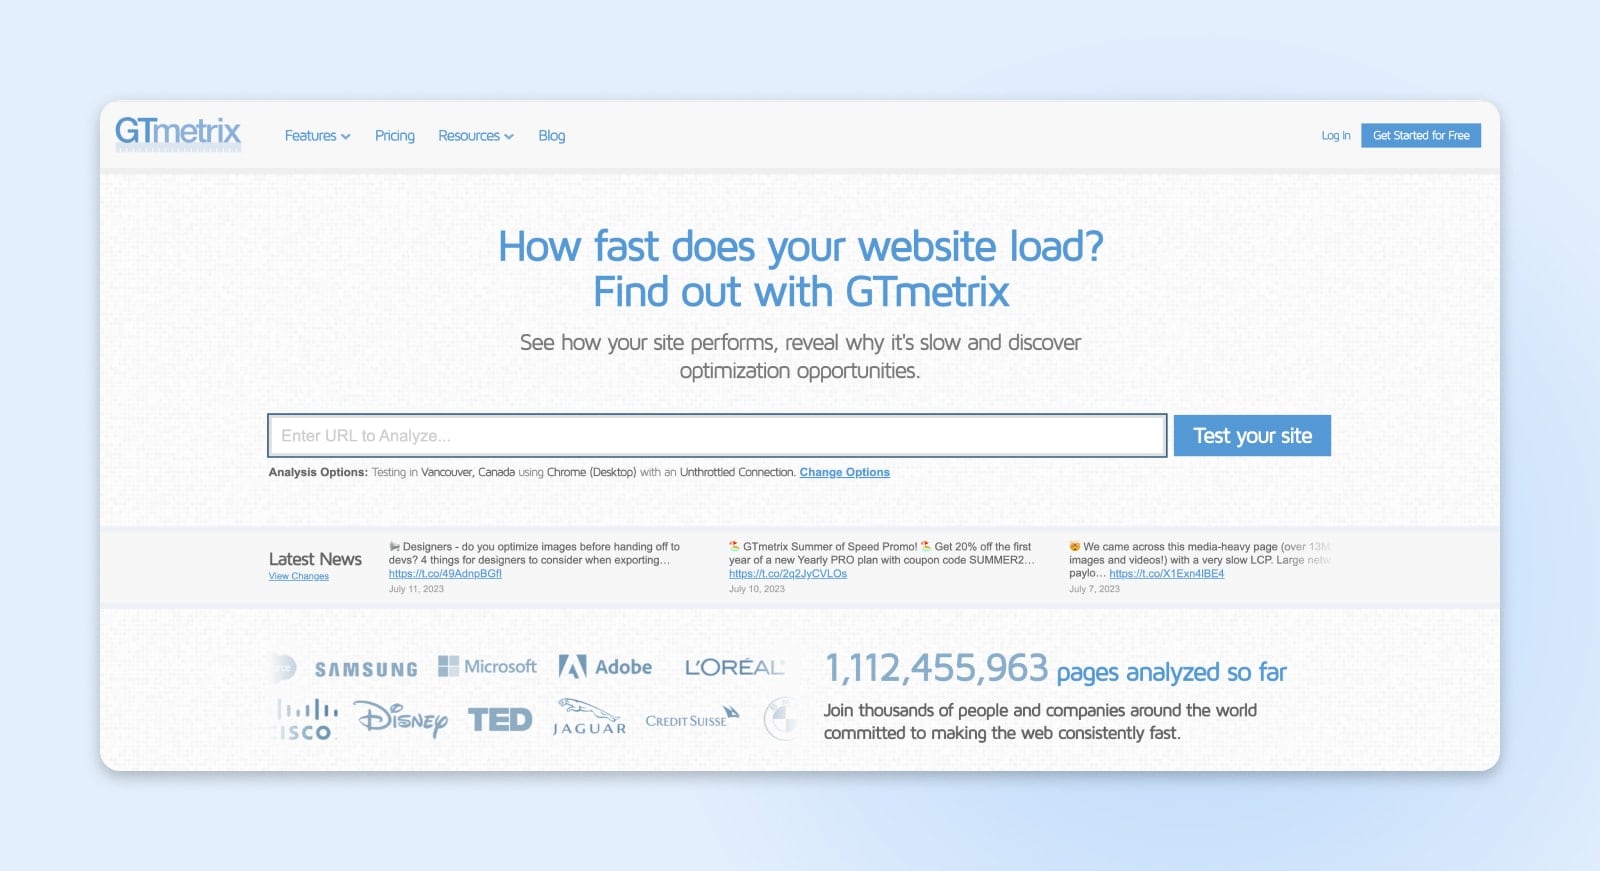
Visit https://gtmetrix.com/.
The entire tool is web-based, so you won’t need to download anything to use it. There are both premium and free versions. The free version is pretty powerful, but to unlock all features, you’ll need a premium GTmetrix account. After a free trial, GTmetrix Pro plans start at $128 per year.
Step 2: Enter Your Website URL
There’s a box on the homepage where you can type in the URL of the website you want to analyze.
Step 3: Choose Your Test Location And Browser (Optional)
GTmetrix offers different analysis options for premium users, like the ability to choose from different test locations and browsers. This can be extremely useful to help you understand your website’s performance from different geographical regions, from different devices and connection speeds. With a premium account, you can use 30 test servers in six geographic regions:
- Vancouver, Canada
- Dallas, USA
- São Paulo, Brazil
- London, UK
- Mumbai, India
- Hong Kong, China
- Sydney, Australia
You can also test with specific browsers, including Google Chrome, Firefox, and mobile browsers, or use different connections, from 56k dial-up to an unthrottled connection.
If you don’t have an account or if you’re using a free account, you can still use the tool. You’ll just be limited to the default settings. If that’s the case, you can just skip this step and go straight to analyzing your site.
Step 4: Start The Test
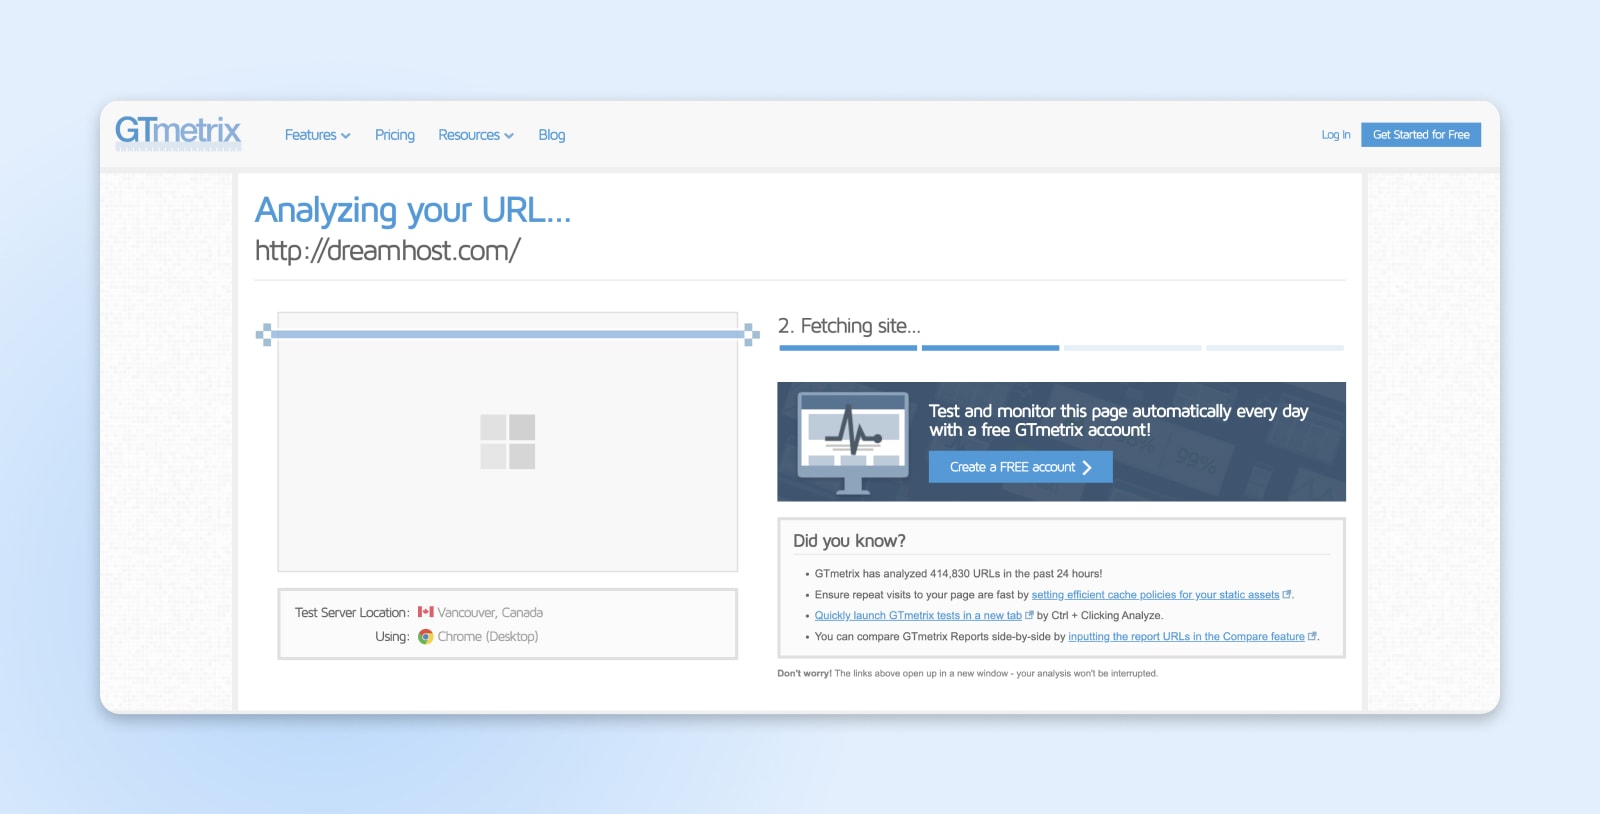
Click the “Test your site” button. GTmetrix will then start analyzing your site. Once it’s done, you’ll get your detailed report, and you can dive in and start analyzing the results. We’ll go over all that below.
Reading And Analyzing Your GTmetrix Report
When your report is finished, before you click into any tabs, you’ll see a page with some key figures.
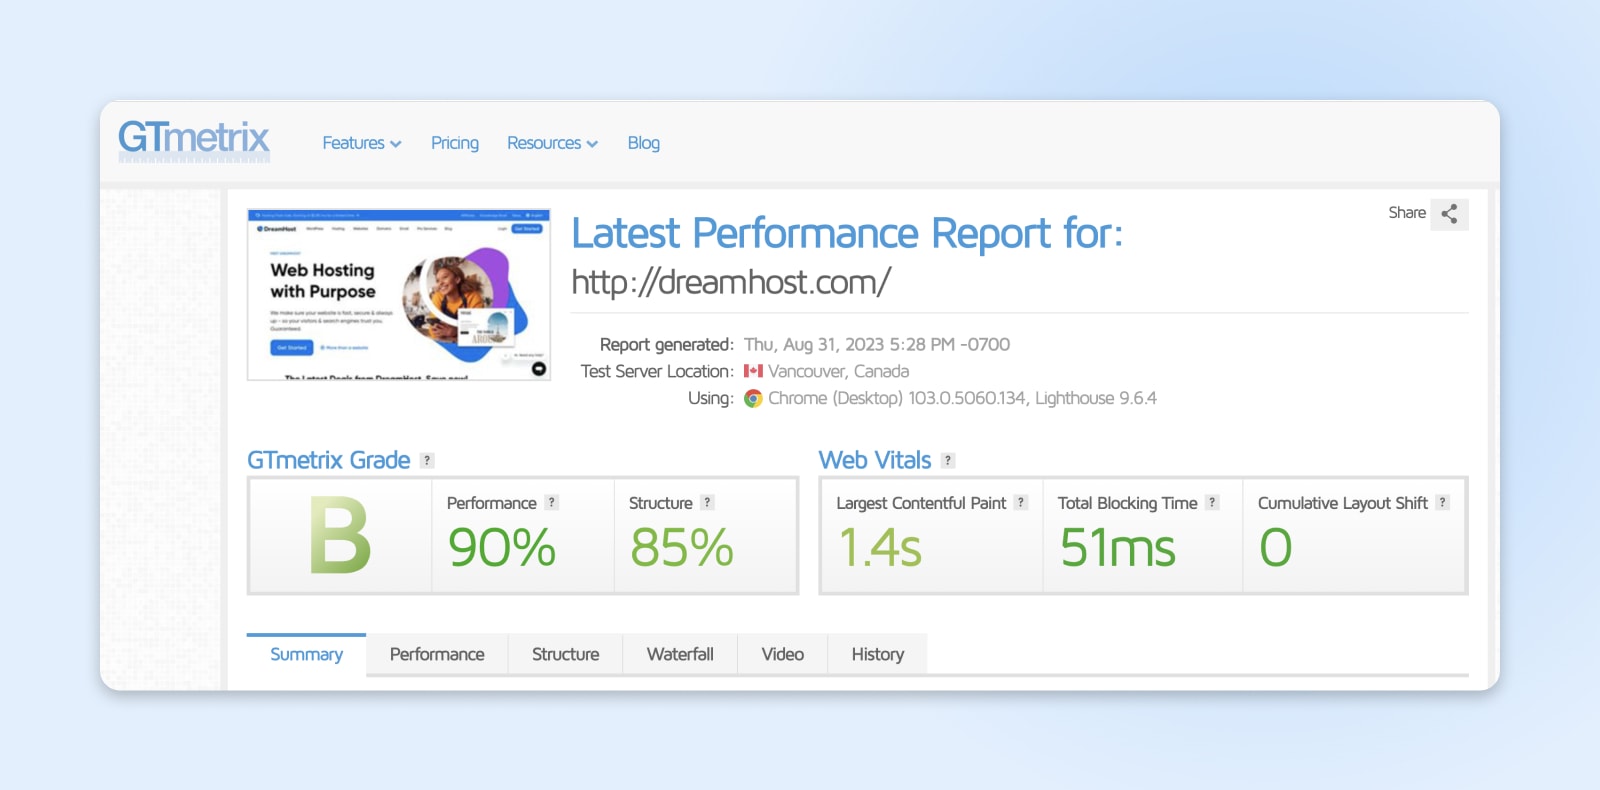
On the left is your GTmetrix grade. This panel shows you three things:
- An overall grade – the closer it is to an “A,” the better.
- Your Performance Score, which measures how well your site performs from the user’s perspective. You can find more details about this score in the Performance Tab, which we’ll explore below.
- Your Structure Score, which measures how well your site is constructed for optimal performance. You can find more details about this score (and how to improve it) in the Structure Tab, which we’ll explore below.
On the right is the Web Vitals panel, which provides the most important measurements on this page:
- LCP (Largest Contentful Paint): measures the time it takes for the largest content element on your page to display in the visible part of the web browser.
- TBT (Total Blocking Time): measure the amount of time that scripts block your web page’s loading process.
- CLS (Cumulative Layout Shift): measures the amount of unexpected layout shift that happens while your web page is loading.
Below all of this information, there are six tabs: Summary, Performance, Structure, Waterfall, Video, and History. Below, we’ll explore how to use the information in each tab in detail.
The Summary Tab
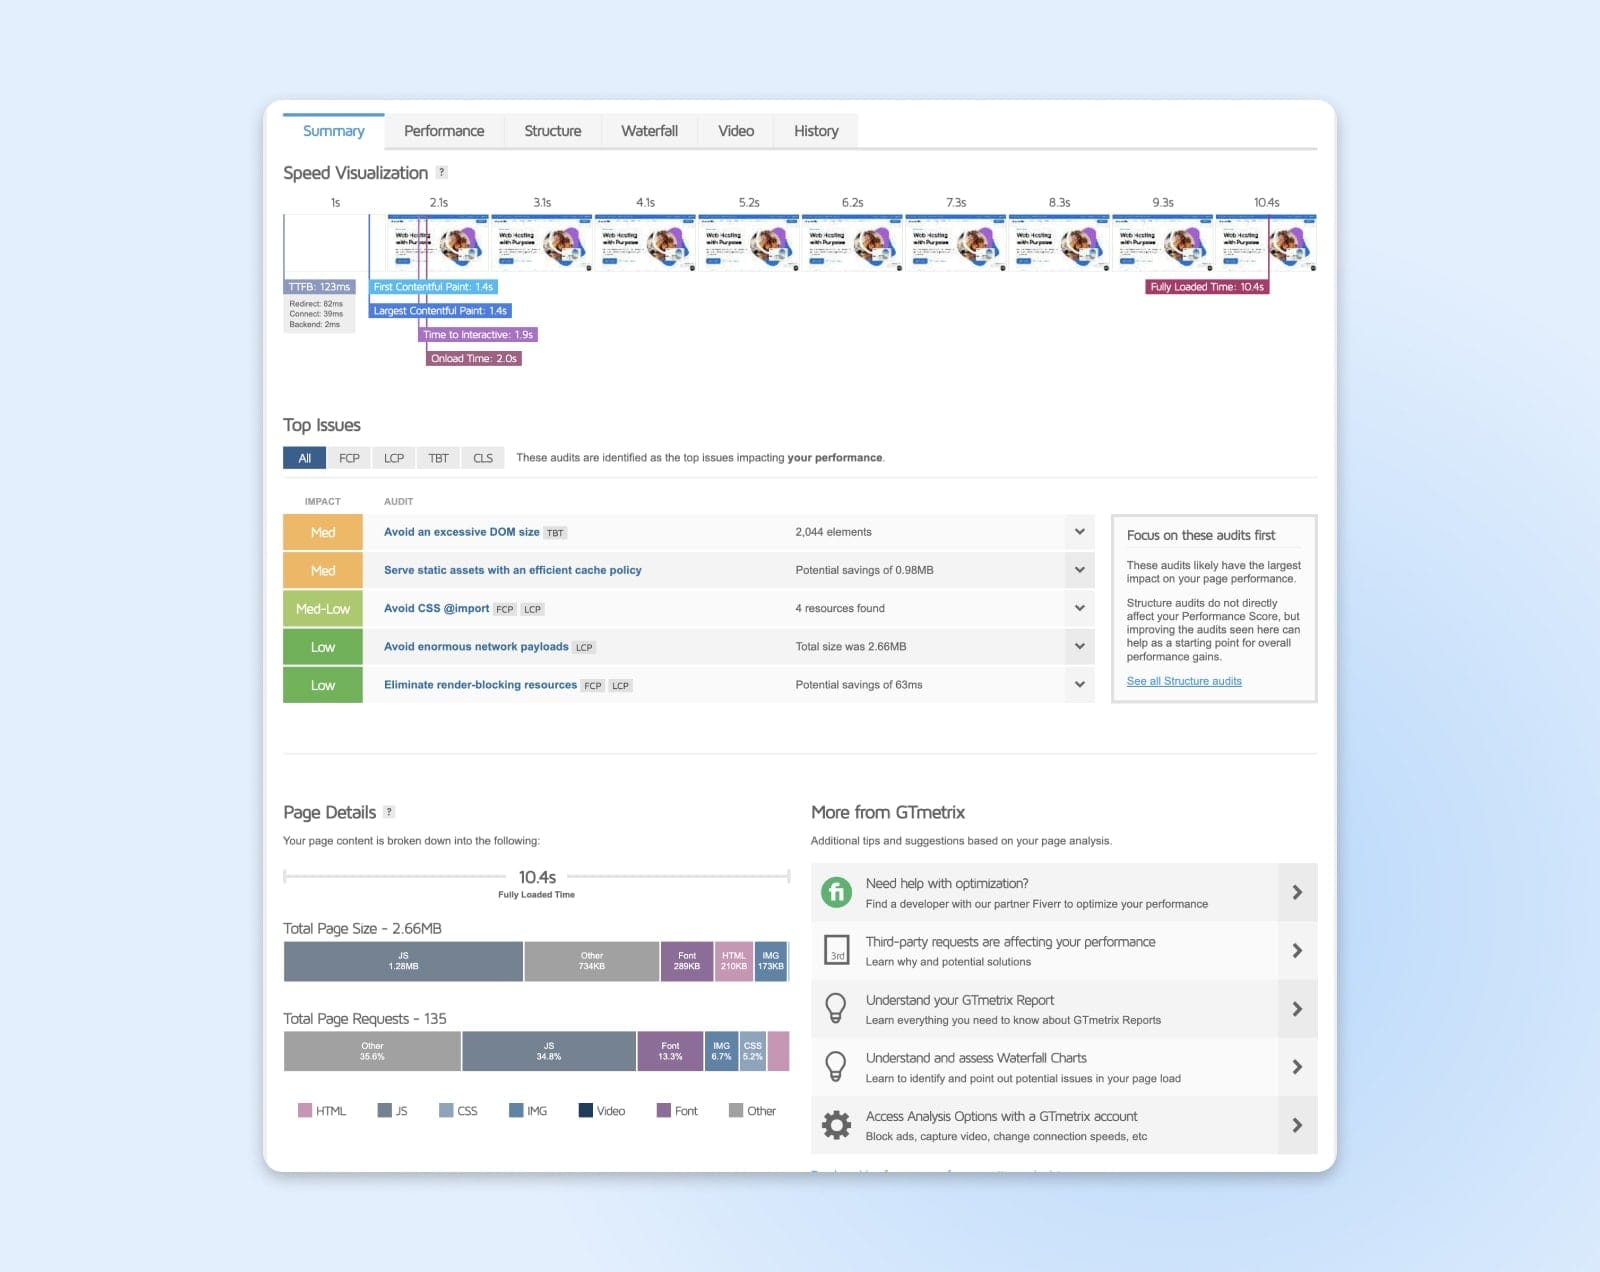
The summary tab provides a snapshot of some of the high-level information GTmetrix learns from its analysis of your site.
At the top of the page is a speed visualization, which shows a timeline of the key events during your page’s load time.
Below that, you’ll see a list of the top issues GTmetrix has identified that are impacting your site’s performance. You can learn more about these in the Structure tab (and we’ll go over them in detail further down).
At the bottom of the summary tab is the page details section, which provides percentages and file size breakdowns of the elements of your page.
You don’t need to spend a lot of time in the summary tab – it’s mostly there for informational purposes, but it’s not where you’ll find most of the actionable information GTmetrix provides.
The Performance Tab
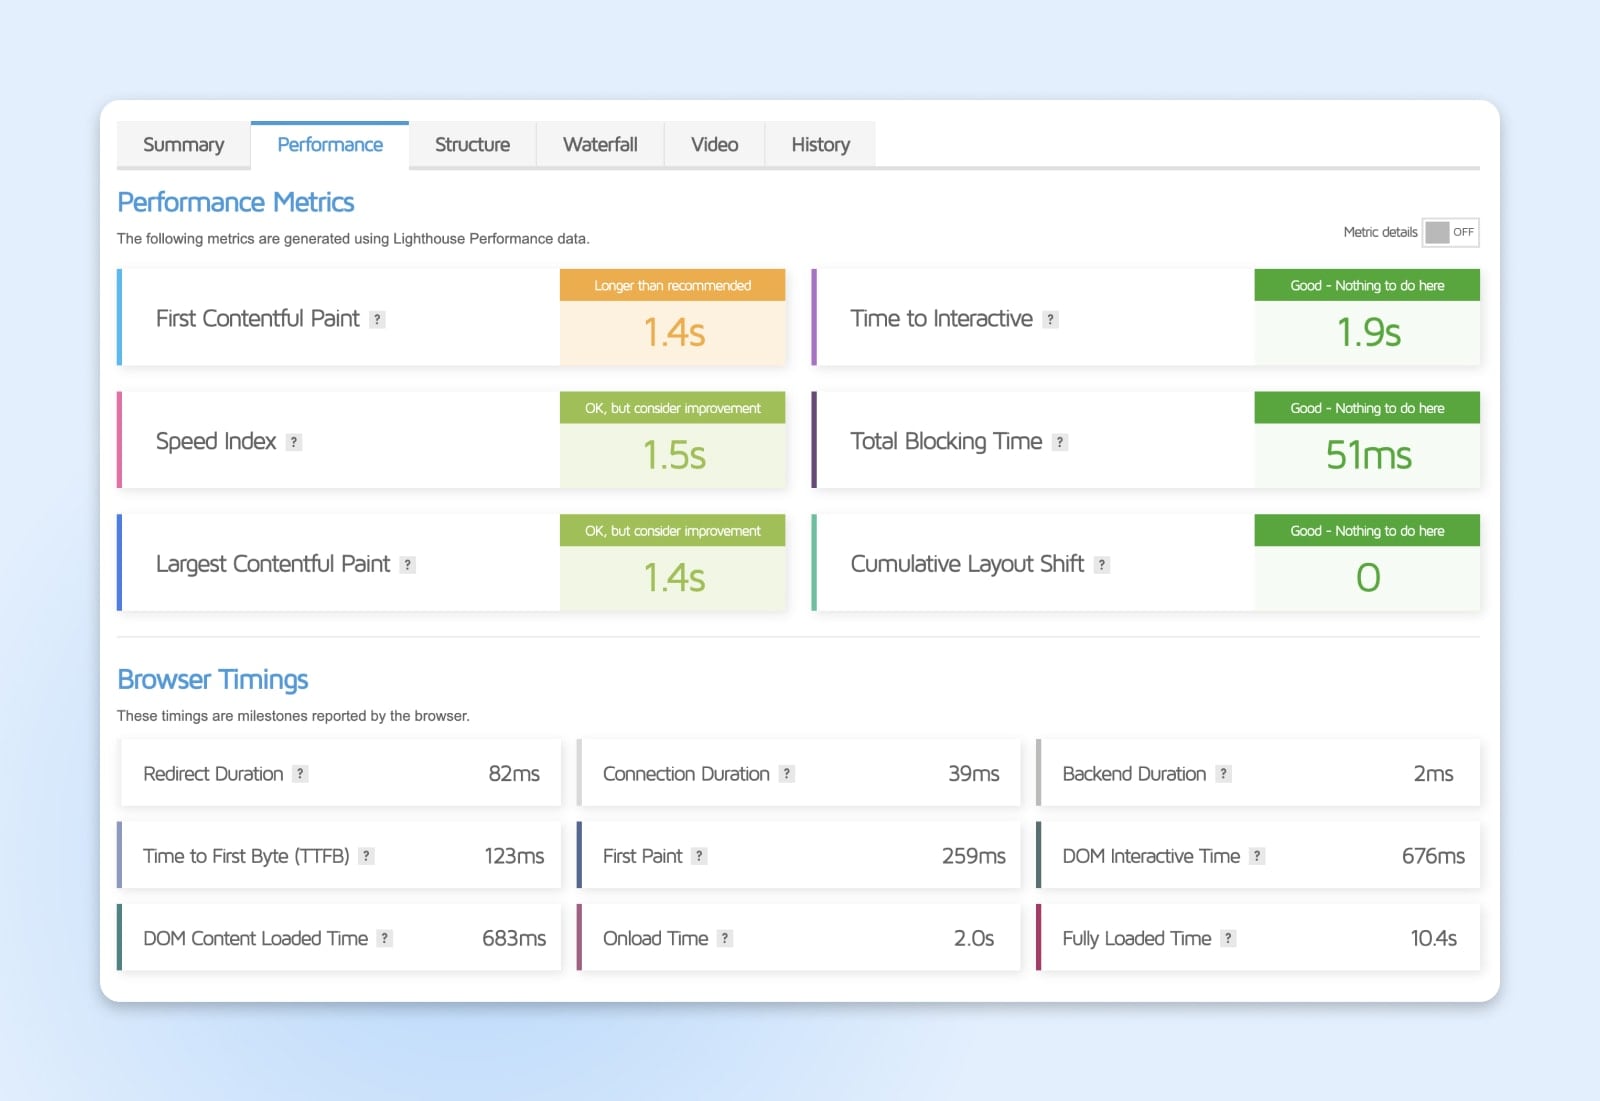
The performance tab is a good place to take a deep dive into your site’s load time metrics. In particular, the Performance Metrics section contains some additional load time figures that aren’t included in the summary tab:
- First Contentful Paint: measures how quickly the first content elements appear on your page. For some sites, this is text – for others, it’s images.
- Time to Interactive: measures how long it takes for your site to become fully interactive – i.e., how long it takes for users to be able to do things like click links and buttons after the page starts loading.
- Speed Index: measures how quickly the content on the page becomes visible to the user.
Below Performance Metrics, you’ll see the Browser Timings section, which includes:
- Redirect Duration: measures the time taken for all redirections (HTTP to HTTPS, domain redirects, etc.) to complete. It starts from the initial request to the last byte of the final redirect.
- Connection Duration: measures the time taken to establish a connection between the user’s browser and the server, including the time taken for the TLS/SSL handshake if the site is using HTTPS.
- Backend Duration: measures the time taken for the server to generate the page. It’s essentially the time from the user’s request to receiving the first byte of data.
- Time to First Byte (TTFB): measures the time it takes from the user making an HTTP request to receiving the first byte of data from the server. It is a crucial metric for understanding server response times.
- First Paint: measures the time it takes for the first visual element to be rendered on the screen. It marks the point where users start seeing visual changes on the page.
- DOM Interactive Time: measures the time it takes for the HTML Document Object Model (DOM) of the page to be fully constructed and interactive, but without waiting for stylesheets, images, and subframes to finish loading.
- DOM Content Loaded Time: measures the time it takes for the DOM to be interactive and for all the scripts to be loaded. Essentially, it marks the point where you could expect the page to be functionally interactive.
- Onload Time: measures the time it takes for the page and all its assets, including images, CSS, and JavaScript, to be fully loaded and the “onload” event to be triggered.
- Fully Loaded Time: measures the time it takes for not only the page to be fully loaded but also for all additional network activity to stop. This is often slightly longer than the Onload Time as it includes the loading of assets that JavaScript might trigger after the Onload event.
Similar to the summary tab, this is a great place to find more information about your site, but it’s still not where you’ll find actionable recommendations for improving its speed and performance – those come in the next tab, structure. Let’s dive in.
The Structure Tab
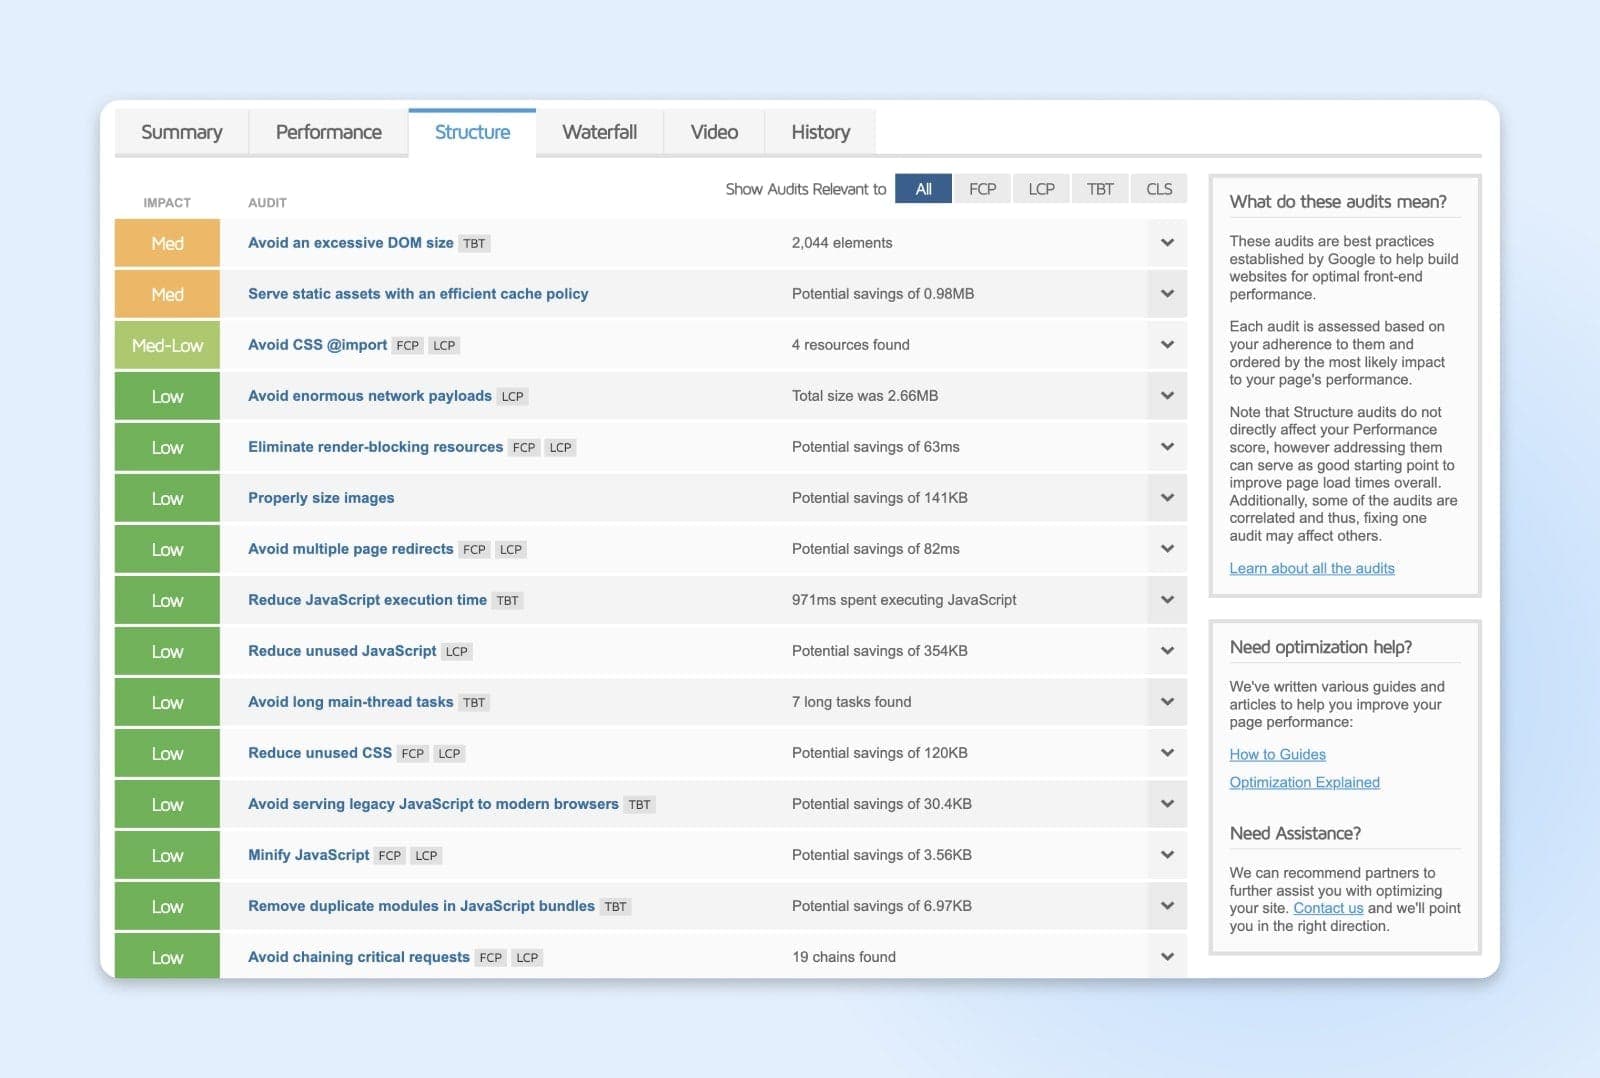
The structure tab is where the magic happens. This is where GTmetrix provides audits based on Google-established best practices for building websites with optimized front-end performance. In this tab, you’ll see a list of all the top issues GTmetrix has identified for your site in order of priority. This means you will see the issues most likely to have the greatest impact on your site’s speed and performance first, at the top of the page.
More than that, GTmetrix will tell you exactly how to solve each issue— Click on the issue to expand it to see a more detailed explanation, and on the upper right, you’ll see a button that reads, “Learn how to improve this.” Clicking it will take you to a GTmetrix tutorial that walks you through the specific fix for whatever issue is holding your site back.
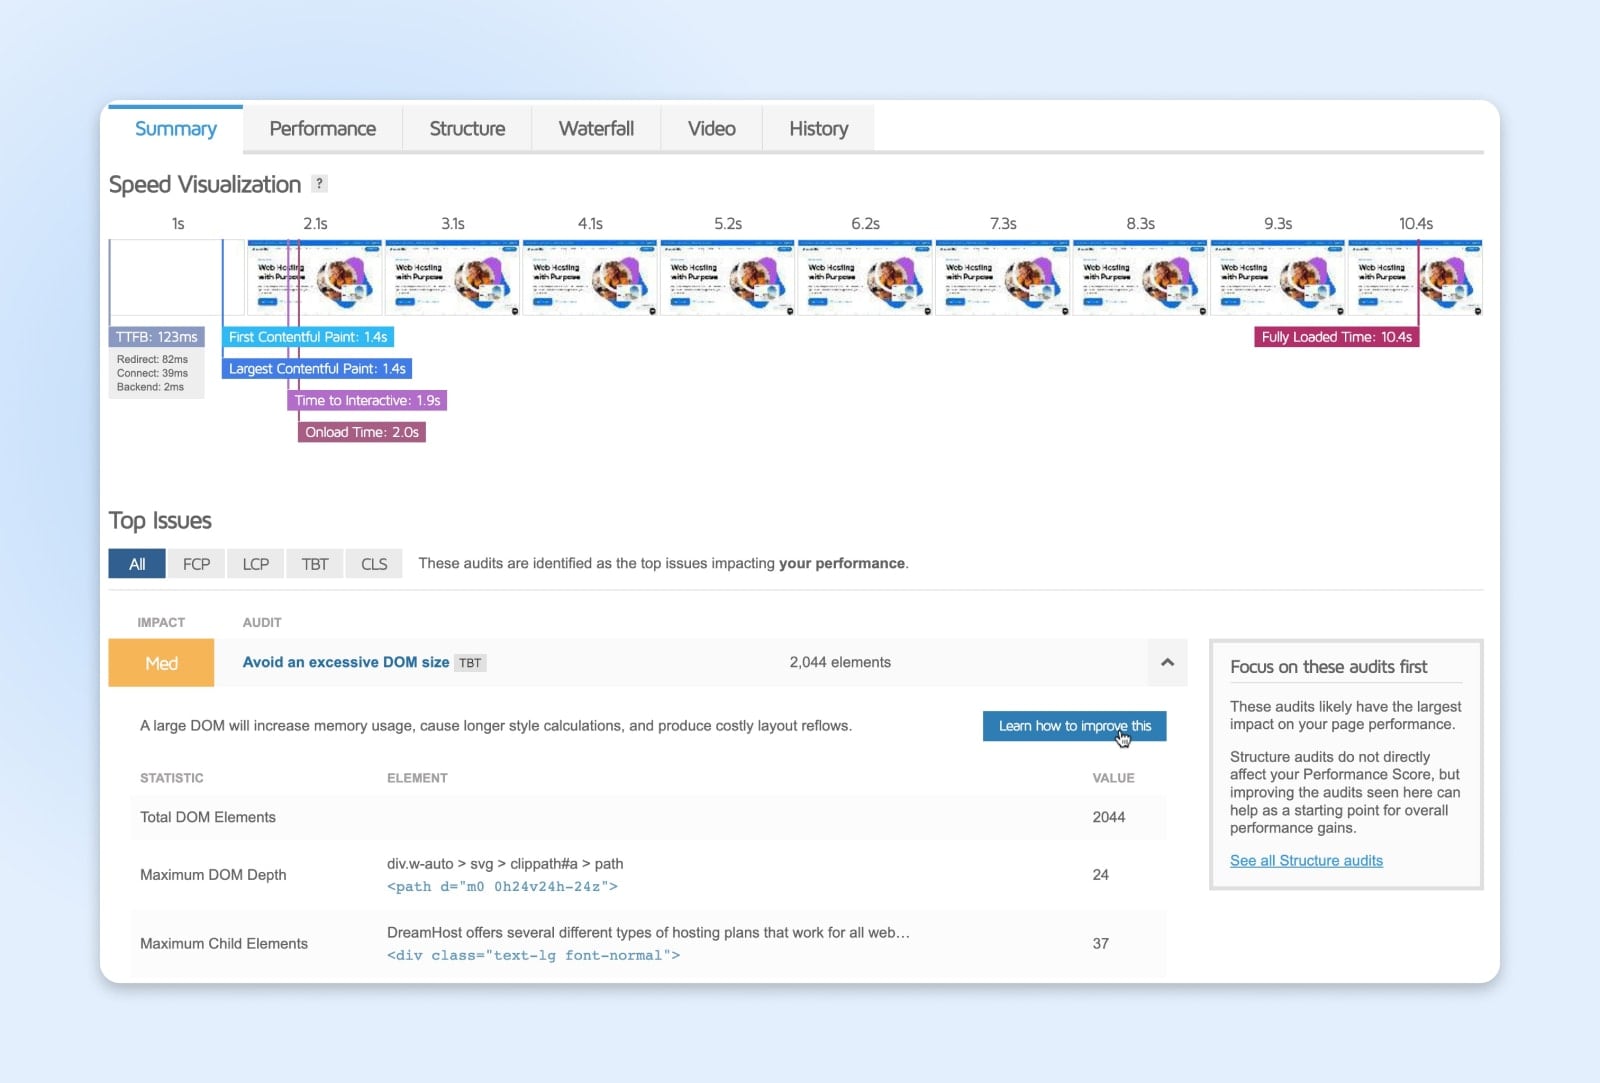
There are nearly infinite issues that can keep your site from reaching optimal speed and performance, but GTmetrix helps you discover and learn how to fix them in just a few clicks. Depending on how many issues your site has, this is where you’ll want to spend the bulk of your time using GTmetrix. Once you’ve solved as many issues as possible, you can explore the rest of the tabs in your analysis.
The Waterfall Tab
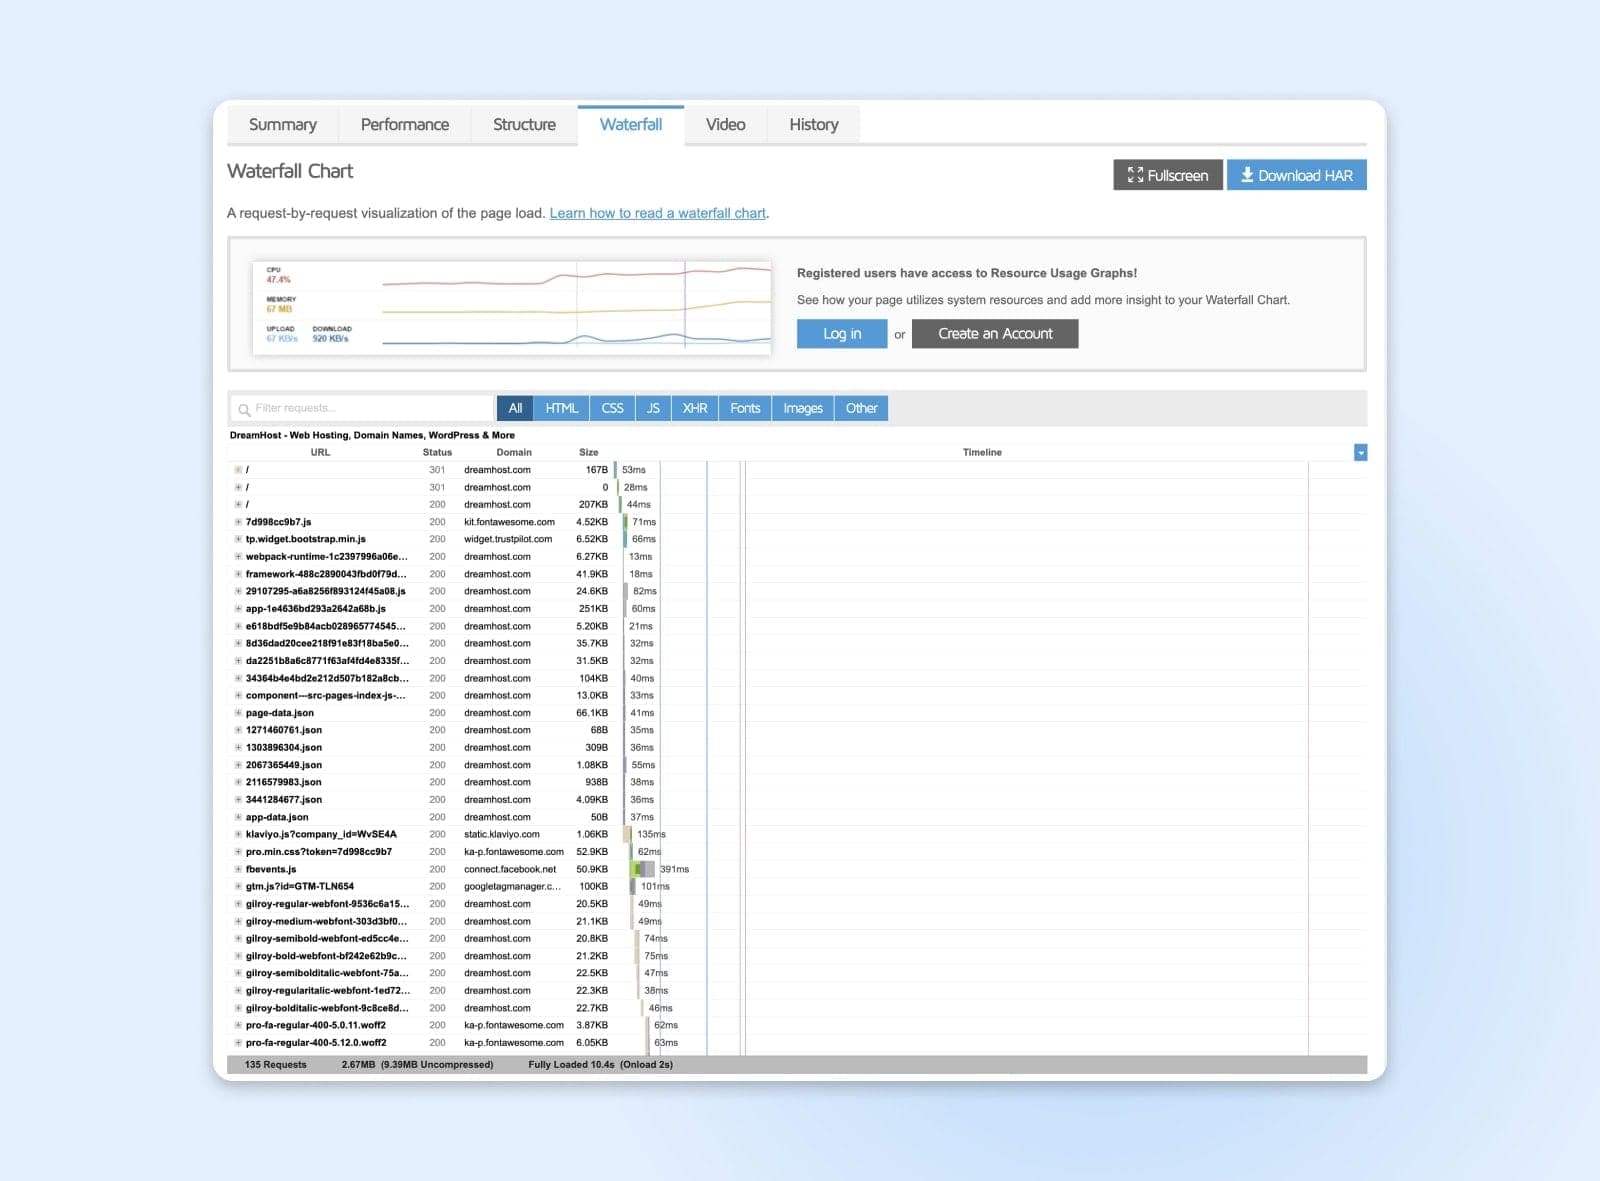
The waterfall tab features a waterfall chart – a graph that shows, in detail, how your website loads. It should show every element, including scripts, media files, requested third-party resources, and their request details, durations, and execution times. The bar lengths indicate how long each element took to request, download, and execute.
The waterfall tab might look overwhelming at first, but it’s a good way to debug performance and page issues, since it can help you visually break your page down, section by section, allowing you to quickly spot bottlenecks or problematic areas.
By showing how different factors or components contribute to an end result, waterfall charts can guide decisions on where to allocate resources, what to prioritize, or where interventions might have the most impact.
The Video Tab
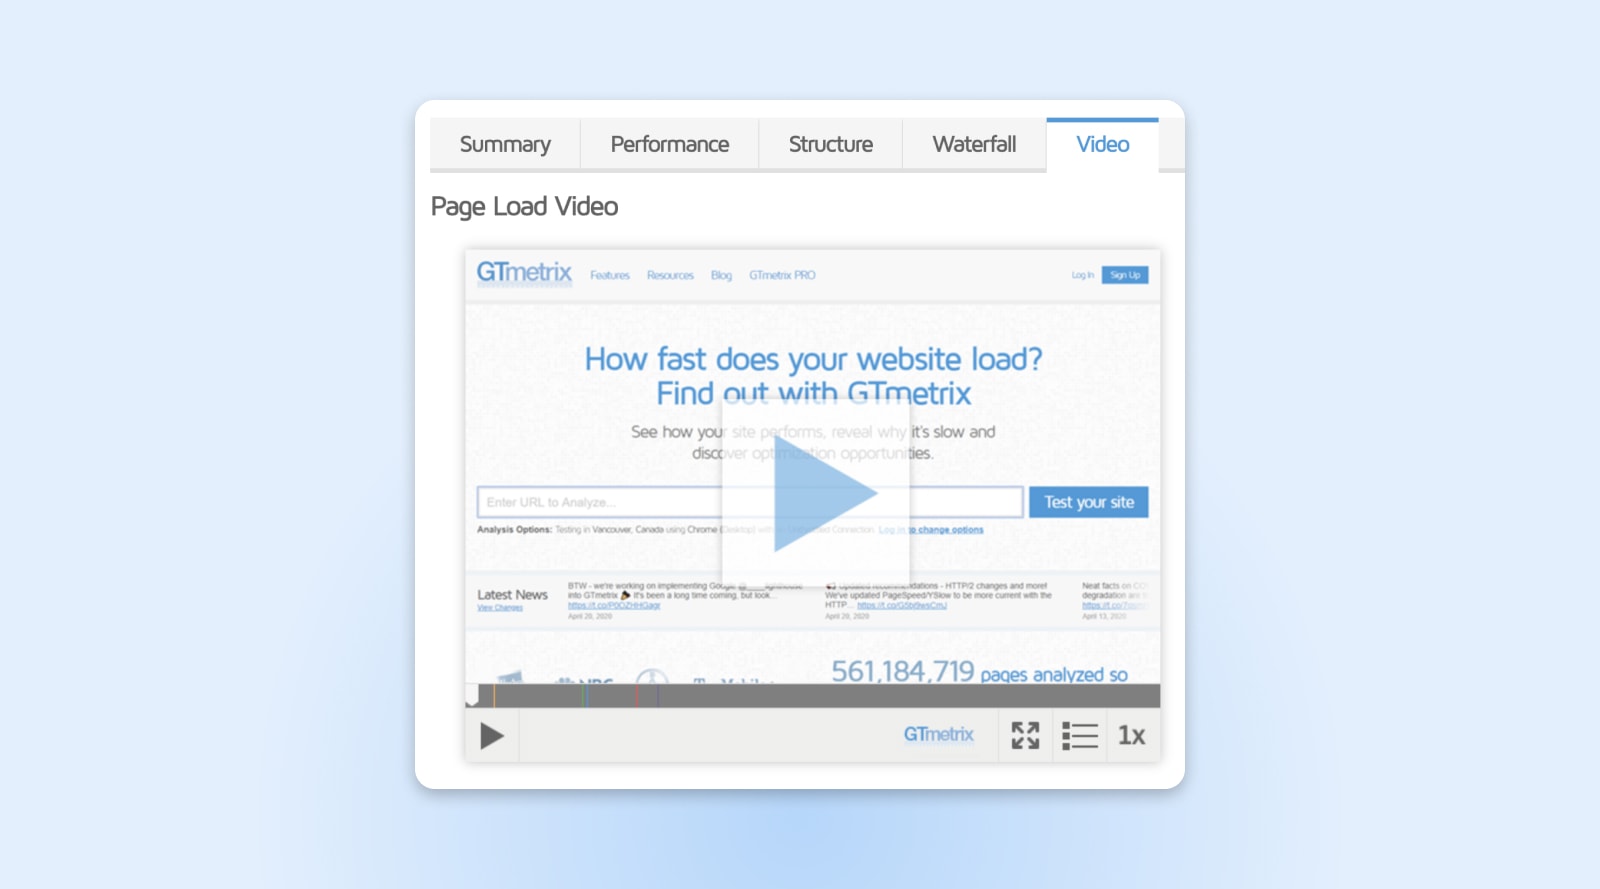
On the video tab, you can watch a video of your page loading to see stoppages and bottlenecks. You can slow the video playback down to better visualize loading behavior and jump to major milestones during your page load. However, you should note that videos are only available if you have a GTmetrix account.
The History Tab
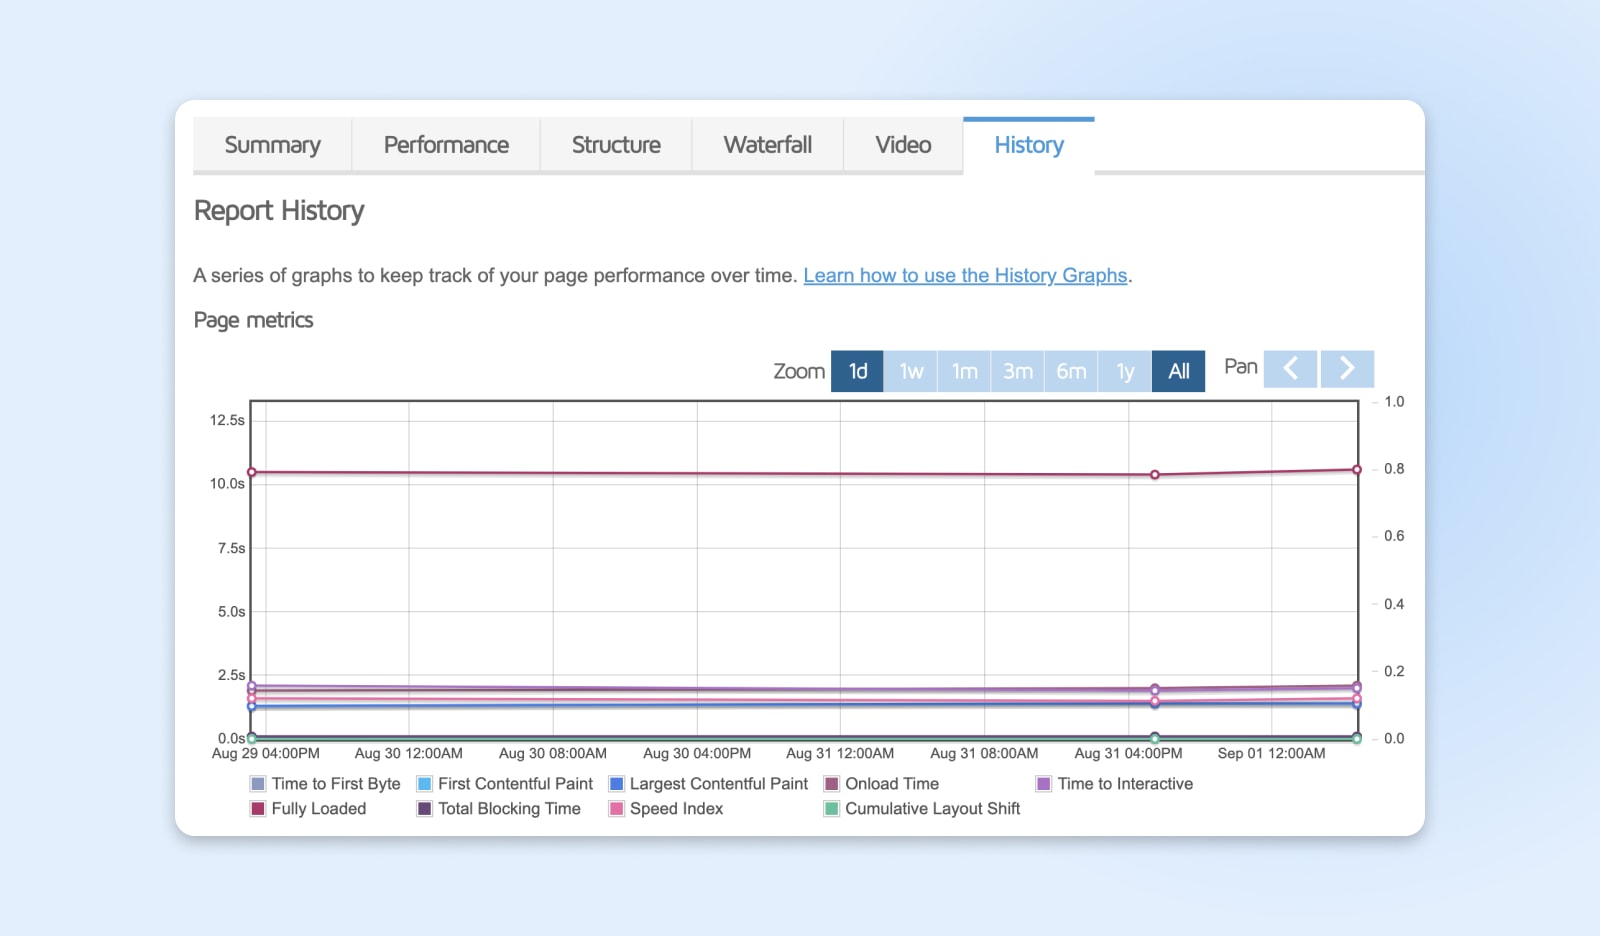
Finally, there’s the history tab. Here, you can view your past reports (if you have an account and are signed in). You can also use History Graphs to compare your site’s functionality with past analyses and track its performance over time.
How To Speed Up Your WordPress Site
The the whole point of using GTmetrix is to get actionable recommendations for optimizing your site that are tailored to what’s actually slowing it down – so definitely start there. Of course, there are still some great best practices everyone can use to make sure their site moves at lightning speed. Try these recommendations if your WordPress site could use a boost:
- Choose a good host. Your web hosting provider is vital to your site’s performance. Opt for a reputable hosting provider that offers resources tailored to your site’s needs, like DreamPress managed WordPress hosting.
- Use a Content Delivery Network (CDN). CDNs can distribute your website’s static content across servers located worldwide, allowing visitors to load the site from a server closer to their location.
- Optimize images. Large image files can slow down your site. Use tools or plugins like Smush, ShortPixel, or EWWW Image Optimizer to compress and resize images without compromising on quality.
- Minify and combine files. Minify your CSS, JavaScript, and HTML files to reduce their size. Plugins like WP Rocket, Autoptimize, or W3 Total Cache can help with this.
- Use caching. Implement caching to store copies of frequently accessed data, reducing the need to regenerate that data. Popular plugins for this include WP Super Cache, W3 Total Cache, and WP Rocket.
- Limit your plugins. Every plugin adds some overhead to your site. Only install necessary plugins, and periodically review and deactivate or delete any that are no longer needed.
- Optimize your database. Regularly clean your WordPress database to get rid of unnecessary data, like post revisions, trashed items, and transient options.
- Reduce redirects. Having many redirects increases page load time, especially for mobile users. Ensure that you limit the number of redirects on your site.
- Use the latest PHP version. WordPress runs on PHP. Ensure your server uses a recent version of PHP for improved performance and security.
- Keep WordPress updated! Regularly update the WordPress core, themes, and plugins to ensure you have the latest speed optimization improvements and security patches.
GTmetrix Frequently Asked Questions
What Is The Difference Between PageSpeed, YSlow, and Web Vitals in GTmetrix?
- Google PageSpeed and YSlow: These are sets of web performance rules and best practices created by Google and Yahoo!, respectively. GTmetrix tests your site against these rules and gives scores based on compliance.
- Web Vitals: Introduced by Google, these are a set of metrics related to speed, responsiveness, and visual stability, aiming to help site owners measure the user experience on the web. Key metrics include Largest Contentful Paint (LCP), First Input Delay (FID), and Cumulative Layout Shift (CLS).
Why Do I Get Different Results When I Test My Site Multiple Times?
A lot of factors can cause variations in test results, including fluctuations in server performance, network congestion, third-party resources, and even GTmetrix’s own server loads. If you’re getting different results from different tests, try running multiple tests and take an average for more accurate insights.
Does Pagespeed Matter To Google?
Yes, PageSpeed does matter to Google. Site speed has been a ranking factor for desktop searches since 2010 and for mobile searches since 2018.
Is GTmetrix Reliable?
Yes, the GTmetrix speed tester is a reliable tool for analyzing website performance. It utilizes well-established metrics and best practices from Google’s Lighthouse and other trusted sources to assess a site’s speed and optimization. Still, like all tools, it’s a good idea to use GTmetrix alongside other performance testing tools to get a comprehensive view of your site’s performance.
How Does GTmetrix Compare To Other Performance Measurement Tools, Like Pingdom?
GTmetrix and Pingdom are both popular and reliable tools for measuring website performance. While both offer insights into page load times, request counts, and page sizes, there are some differences:
- Metrics and recommendations: GTmetrix bases its recommendations on Google’s Lighthouse and YSlow, while Pingdom has its own set of performance insights.
- Testing locations: Both tools allow testing from different geographic locations, but the available locations might vary.
- Features: GTmetrix offers video playback of the loading process for some plans, while Pingdom provides uptime monitoring and more extensive website monitoring services.
Is GTmetrix Free?
GTmetrix offers a free version that allows users to test and analyze their websites. However, for more advanced features, such as multiple test locations, priority access, or more frequent monitoring, they offer premium plans.
What Is A Good GTmetrix Grade?
GTmetrix grades websites based on their adherence to performance best practices. It’s just like in school – an A grade is considered excellent. Still, sites with Bs or even Cs can provide a good user experience. Instead of just focusing on the grade, it’s more important to address the specific recommendations provided by GTmetrix that can improve user experience.
Is A Higher GTmetrix Score Always Better?
While a higher score generally indicates better optimization, it’s essential to focus on the real-world impact. Sometimes, a perfect score isn’t necessary if the user experience is already excellent. Always prioritize actual site performance and user experience over chasing a perfect score.
What Do I Do If I Get A Bad GTmetrix Grade?
GTmetrix provides actionable recommendations based on the results. Common suggestions include optimizing images, leveraging browser caching, minimizing redirects, and reducing server response times. Still, the recommendations you receive will depend on your site and what would be most impactful to optimize it based on its needs.
How Long Should My Site Take To Load?
While it’s ideal for a site to load as quickly as possible, a common benchmark is aiming for a load time of 2-3 seconds or less. Google’s research indicates that as page load time goes from 1s to 3s, the probability of bounce (a user leaving the site) increases by 32%. However, the “acceptable” load time can vary based on the industry, the type of content on the site, and user expectations. It’s always good practice to benchmark against competitors and continuously work on improving load times to provide the best user experience.
Get More Visitors, Grow Your Business
Our marketing experts will help you earn more traffic and convert more website visitors so you can focus on running your business.


