2024 Private SaaS Company Valuations

Valuing private SaaS companies can be a fraught and confounding process in which two groups can look at the same numbers and arrive at widely different results. As our long-time readers know, we have sought to provide an objective, data-driven reference point to help overcome the challenges presented by valuing private SaaS companies.
SaaS Capital has been providing debt capital to private B2B SaaS companies since 2007. Over this time, we’ve funded more than 130 firms, which gives us a privileged window of insight into equity raises and M&A transactions. Using our position in the marketplace and the information it provides, we published our first private SaaS valuation framework in 2016.
Over the years, we have refined our methodology to create a stable valuation framework that uses current data from the SaaS Capital Index™, which is updated monthly. This data-driven methodology is based on a statistical analysis of over ten years of data. The result is a downloadable Excel model built on the three primary variables that drive private B2B SaaS valuation:
Since these inputs are dynamic (that is the specific values can be updated with the latest available data), the model can be used at any time and across market regimes to help establish a foundation for valuing private B2B SaaS companies.
The latest white paper from SaaS Capital on valuing private SaaS companies can be found here – What’s Your SaaS Company Worth?
2024 Public SaaS Valuation Multiples
Public market valuations are a natural starting point for developing a private company valuation methodology. They reflect the summation of countless participants transacting on real-time information. Moreover, they have high data integrity as they cover a broad sample size of different companies and are based on audited financial results.
We developed the SaaS Capital Index to capture what we feel is the best composite of the public company B2B SaaS universe and serve as a near real-time snapshot for the valuation multiple assigned to public SaaS companies. As a reminder, with software-as-a-subscription (SaaS) companies, we use revenue multiples to describe their valuations, rather than earnings multiples like in traditional price-to-earnings multiple. This is for two main reasons:

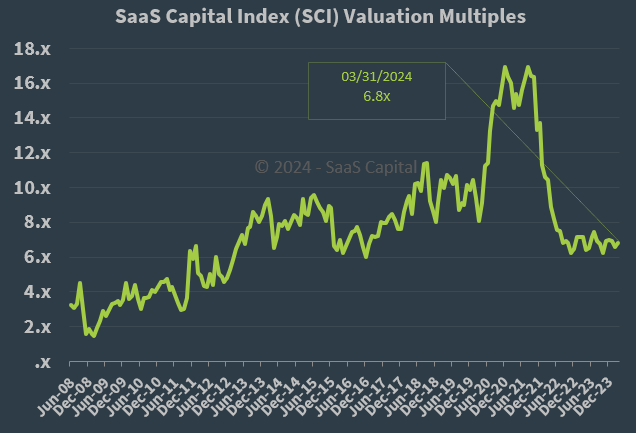
As of March 31, 2024, the SCI median valuation multiple stands at 6.8 times current run-rate annualized revenue (we believe run-rate revenue is the most accurate measure of the current scale of the business). While the multiple has stabilized in the 6-7x range, it is down roughly 60% from its peak achieved in 2021.
The median valuation multiple is now at levels last seen in the 2015-2016 period. However, there are important differences between the current multiple and those of 8-9 years ago. Most significantly, the current valuation multiple is supporting a very different balance between growth rate and profitability for the median company. [See our recent research: Why Long-Term SaaS Revenue Growth Rates are Slowing; and What it Means for Your Private B2B SaaS Company].
Private SaaS Company ARR Growth Rates
ARR growth rate is a critical metric for companies and the primary variable impacting changes in private company valuations in our model. We calculate it by annualizing realized trailing revenue growth figures. It should not be based on forecasts.
SaaS Capital recently completed its 2024 survey of private, B2B SaaS companies. Based on the most recent survey (see table below), revenue growth rates, in general, have moderated from the highs seen in the 2022 survey; however, when measured from their levels in the 2021 survey, private SaaS companies have continued to experience expanding growth rates or, for the larger private companies, smaller declines in growth rates compared to the public SaaS companies in the SCI.

Private SaaS Company Net Revenue Retention Rates
Net retention rate is the final variable in our valuation model. It is an important quality-of-revenue metric that, while related to growth, also offers information about revenue quality, customer satisfaction and pricing power.
Based on our 2024 survey, retention rates continue to be quite strong across ARR size, ranging from a low of 100% for companies below $1 million in ARR to 104% for companies above $20 million in ARR (see table below).

What is the Current Private SaaS Company Valuation Multiple?
The modeled private SaaS company valuation multiple is 4.1x as of March 2024.
This value reflects the calculated valuation multiple for the median private B2B SaaS company and is derived using the following values – taken from the latest SaaS Capital benchmarking survey – as inputs:
- SCI valuation multiple of 6.8x
- Median ARR growth rate of 30%
- Median NRR of 101%
The median 4.1x valuation multiple represents a roughly 40% discount to the current SCI valuation multiple and is below the 2023 modeled private SaaS median valuation multiple of 4.6x.
2024 Private SaaS Company Valuation Multiples by Company Size
Digging a little deeper, we can look at median valuation multiples by ARR, using as inputs median ARR growth rate and NRR for each silo of ARR. The table below presents the results based on the 2024 annual survey and compares these to the results from the 2023 annual survey.

Excluding companies with less than $1 million in ARR, the current modeled valuation multiple declined from the modeled values based on the prior year’s survey.
Again, this is intended as a launching point for arriving at a company’s valuation. Specific companies with higher or lower ARR and NRR values will realize different multiples. Nevertheless, we believe it is important for private SaaS companies to recognize the overall direction and estimated level of current valuation multiples such that they can build appropriate business and financing plans going forward.
Recent Observations:
- In Q1 2024 US public equity markets hit all-time highs, but those highs are being driven predominately by a small group of big cap tech companies (Microsoft, Facebook, Netflix, Amazon, etc.) and artificial intelligence-related companies like NVIDIA, rather than B2B software.
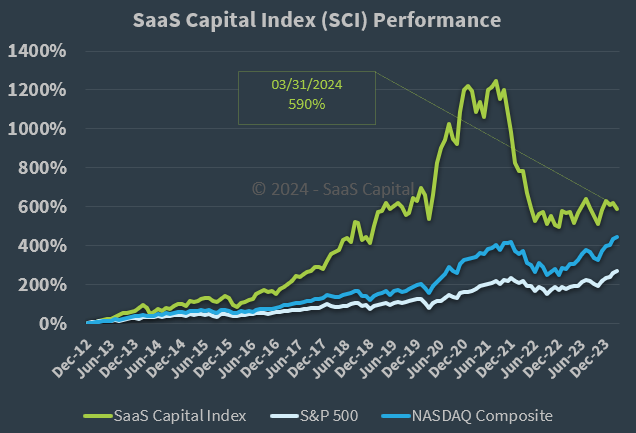
- Indeed, the SaaS Capital Index has decoupled from the broader NASDAQ and S&P 500 indices over the last year, remaining well below its highs of 2021 while the NASDAQ and S&P 500 have surpassed their previous highs. This is the first time in nearly 10 years that the SaaS Capital Index has failed to outpace the broader market during a sustained advanced in equities. What price appreciation that has occurred in the SCI over the past two years has been driven by increases in revenue at the underlying companies rather than an expansion in the valuation multiple.

- Adding to the recent torpor in the public SaaS market is the near complete absence of initial public offerings over the past two years. Yes, some deals have been done, but on the whole activity is moribund.
- From our perspective, the absence of deals is not because companies are not seeking to transact – VC and PE outfits are sitting on a mound of “dry powder” and private SaaS companies need financing to expand operations or cover losses – but, rather, because participants do not want to transact at the expected price.
- The bid-ask spread between would-be seller and investor remains too wide for all but the most extreme cases to traverse. Both sides seem to be anchored to levels, which in our estimation are not appropriate. Sellers remain, largely, tied to the double-digit multiples that existed several years ago while equity investors, with one eye on the steep decline in multiples that has already occurred and the other eye watching for the other recessionary shoe to drop, are not keen to transact at even more modest multiples.
- As a result of the above, macroeconomic considerations notwithstanding, a potential tsunami of deals could occur in the back half of 2024 or 2025 should one or both sides reset their expectations.
- Revenue growth rates of private B2B SaaS companies have outperformed those of public SaaS companies in the SCI on a relative basis, both from their respective peaks in 2021 as well as from their pre-covid levels. One potential explanation for this relative outperformance against their public sector counterparts is that smaller scale companies still have a lot of overhead room into which to grow unlike larger operators whose market size and growth may be more sensitive to GDP and macroeconomic factors.
- From our perspective, the theme of 2024 continues to be uncertainty. There are numerous macroeconomic crosscurrents that make definitive proclamations even more problematic than usual. Nevertheless, we observe increasing conviction among participants about how events will unfold –whether it be in imminent rate cuts, a soft-landing, impending recession, or re-acceleration of economic activity. In our opinion, such certainty is not just misplaced but risks painfully wrong-footing companies and investments should the world look different than anticipated.
- In 2022, we urged companies to seize control of their own destiny by ensuring an adequate runway for their strategies or even by achieving profitability. We reiterate that advice here. For companies looking to raise capital, we believe they should be proactive and follow the rubric of raise when you can and not when you have to.
- To borrow a phrase from fixed-income manager Jeffrey Gundlach, the one thing more powerful than greed or fear is need. Rates may fall, the IPO market may start humming again, or we could enter a recession and watch growth falter and valuations sink. We believe the best course of action for SaaS operators and investors is to ensure their success is not dependent on a specific uncertain outcome, but rather that they are well-positioned regardless of the outcome.
You can click here to join the SaaS Capital community and receive actionable insights and benchmarking.
![]()


